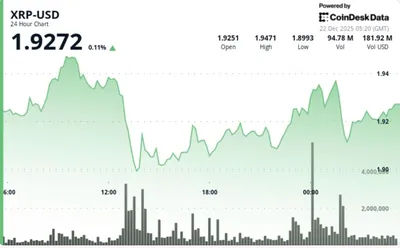
XRP began January 2026 with a sharp move higher, jumping about 20% in the first week and topping out near $2.41 on Jan. 6. As of Jan. 24, the token is trading at $1.91, having eased back into a tighter range. Despite recent weakness, several on-chain and chart-based signals suggest the market is in a consolidation phase rather than a clear downtrend.
XRP's Recent Price Movements
After the early-month peak at $2.41, XRP has pulled back and is now hovering around $1.90–2.10, reflecting compressed volatility and mixed sentiment. The coin is down 0.4% on the day and has shed 7.7% over the past seven days, while remaining up 2.3% over the last 30 days. For a focused market read, see our XRP market analysis, which reviews these recent ranges and volume patterns.
Market Analysis and Signals
On-chain data from Glassnode shows a drawdown in exchange balances, a sign that immediate sell-side pressure may be easing. In parallel, U.S. XRP exchange-traded funds have attracted $1.23 billion since trading began, marking a notable flow of capital into the asset class. Chartists have highlighted these developments in combination with price structure as reasons to watch for a larger resolution.
Technical Indicators and Predictions
Analyst Egrag Crypto argues the recent pullbacks fit a repeatable bullish structure: price repeatedly tapping rising support near a key short-term moving average and carving higher lows during consolidation. From that structural view, Egrag points to a potential upside zone between $15 and $22, while noting the thesis depends on broader structural support holding. Another observer, Chartnerd, says the price action mirrors prior accumulation phases where volatility tightens before a larger move.
Risks and Considerations
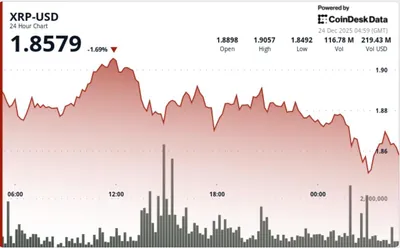
Despite the bullish readings, higher-time-frame charts still signal risk if key moving averages are not reclaimed, and confirmation hinges on a clean break above the $1.95–2.10 resistance band. Macro uncertainty is also cited as a factor that could keep recoveries muted, and failure to hold structural support would invalidate the bullish interpretation. For context on downside scenarios and recent breaks, consult the price drop analysis.
Why this matters
If you run from one to a thousand mining devices in Russia, these developments affect the market environment you sell into even if they don't change your day-to-day operations. Exchange outflows and $1.23 billion of ETF inflows are signs that one source of selling pressure has shifted, which can influence short-term supply dynamics and price stability.
At the same time, the current consolidation and the need to reclaim moving averages mean volatility and range-bound trading could persist, so miners should expect periods of weaker spot prices alongside occasional rebounds. Watching these structural signals helps you plan sales or hold decisions without overreacting to single-session moves.
What to do?
Set clear rules for production and sales based on your costs: track electricity and operational breakevens, and avoid ad-hoc selling after short pullbacks. Use price alerts around the $1.95–2.10 band and for any reclaim of key moving averages to mark potential confirmation of a trend change.
Keep an eye on on-chain metrics and ETF flows as part of your routine: exchange balance drawdowns and sustained inflows can change available supply, while failure to hold structural support would be a signal to tighten risk controls. In short, prioritize cost management, predefined sell thresholds, and monitoring of the structural levels named by chartists rather than reacting to every volatility spike.