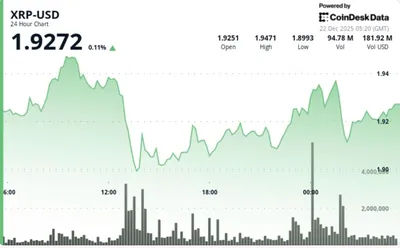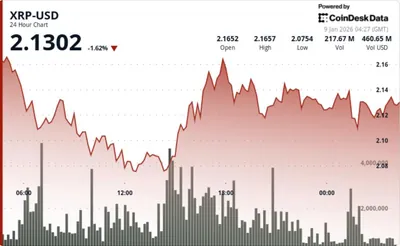
At 2:30 p.m. on Jan. 10, XRP is trading near $2.09, with only modest intraday fluctuation around that level. The price action is narrow and appears to reflect consolidation rather than a decisive move in either direction, following earlier attempts to regain ground near $2.13. Technical indicators show subdued momentum: the Relative Strength Index sits near 49.40 while the MACD histogram is slightly negative at about -0.0039.
XRP Price Consolidation Overview
XRP is holding just below the $2.10 area, oscillating in a tight range and showing limited volatility. On short-term charts the midline of the Bollinger Bands is near $2.0902, the upper band around $2.1018 and the lower band near $2.0822, with volume moderated compared with prior spikes; this setup points to compression rather than a clear breakout or breakdown.
The recent range-bound trading reflects hesitation from both buyers and sellers while market participants digest the recent institutional and regulatory developments. For more on comparable price snapshots and market context, see consolidation around $2.12, which covers similar short-term patterns.
Ripple's Regulatory and Institutional Developments
Ripple has received approval from the U.K. Financial Conduct Authority for an Electronic Money Institution licence and for crypto asset registration, expanding its regulated presence in that jurisdiction. This regulatory step sits alongside Ripple’s collaboration with BNY, which has moved tokenized deposits into live institutional use and supports on‑ledger settlement workflows tied to enterprise infrastructure.
At the same time, XRP has gained exposure through multiple spot exchange-traded funds while retaining court-defined regulatory clarity in the United States as a non-security digital asset. Those developments together underline growing institutional engagement with the asset and with the broader XRP ecosystem; additional context is available in our XRP price and analysis.
XRP Ledger Milestones
Activity on the XRP Ledger has surpassed $1 trillion in total value settled, supported by growth in real-world asset issuance and expanding stablecoin liquidity pairs. Rising institutional balance-sheet participation is also cited as a contributing factor to the ledger’s increased settled value, signaling deeper usage beyond speculative trading.
These on‑ledger flows and institutional integrations provide additional context for the current consolidation, suggesting that some of the market’s calm may be related to structural adoption rather than only short-term technical dynamics.
Technical Analysis and Market Indicators
From a technical perspective, XRP is consolidating below the $2.10 area after earlier attempts toward $2.13, with price trading close to shorter-term moving averages near $2.1034 and a higher moving average around $2.1355. Bollinger Bands are relatively compressed, which reinforces the theme of tightening volatility and short-term equilibrium.
Momentum indicators remain muted: the RSI is near 49.40, in neutral territory, and the MACD is slightly negative with a histogram around -0.0039 while MACD and signal lines track closely together. Taken together, these readings point to subdued momentum rather than strong directional pressure.
Bullish and Bearish Scenarios
Bullish scenario
If XRP continues to defend support above the $2.08 region and presses through the $2.10–$2.11 area, short-term buyers could regain control and the market structure would read as compression ahead of a potential extension. An accompanying expansion of the Bollinger Bands and improving MACD momentum would strengthen the case for renewed upside toward prior intraday highs.
Bearish scenario
Failure to hold above roughly $2.09, followed by a sustained move below the lower Bollinger Band near $2.08, would shift the near-term balance toward sellers. In that case, weakening RSI and a widening negative MACD could coincide with deeper retracement as consolidation gives way to price deterioration.
Почему это важно
Если вы управляете майнинг-оборудованием, эти новости вряд ли изменят ваши повседневные операционные решения напрямую, поскольку они касаются институционального использования и регуляторных статусов вокруг XRP. При этом рост институционального использования и большой объём расчётов на реестре могут влиять на ликвидность и волатильность рынка в целом, что стоит учитывать при управлении портфелем и деньгами на биржах.
Нейтральные технические индикаторы и текущая консолидация означают, что резких сигналов на рынке нет, поэтому спешить с изменением стратегии обычно не требуется. Важно следить за ключевыми уровнями в статье и сохранять дисциплину в управлении рисками.
Что делать?
Установите оповещения на ключевые уровни, упомянутые в статье — около $2.08 и зоны $2.10–$2.11 — чтобы оперативно реагировать на пробой или удержание поддержки. Это даст вам быстрый сигнал о смене структуры рынка без постоянного мониторинга графика.
Пересмотрите ликвидность и расположение средств: убедитесь, что ваши запасы фиатных и криптоактивов распределены с учётом риска волатильности, а также держите резерв на оплату электричества и обслуживания оборудования. В долгосрочной перспективе следите за дальнейшими институциональными внедрениями и регуляторными шагами, которые могут менять профиль спроса на актив.