Blockchain analytics firm Glassnode reports that XRP's onchain picture today mirrors a market structure previously seen in early 2022. Although price action can seem calm, the firm highlights growing tension between recent buyers and longer-term holders, centered on a key psychological level. Repeated tests of the $2.0 zone have produced significant realized losses, pointing to mounting stress beneath the surface.
XRP's Current Market Structure
Glassnode's analysis shows short-term investors active over the 1W–1M window are accumulating at price levels below the cost basis of the 6M–12M cohort. This creates a layered cost-basis profile where newer entrants sit at lower realized prices than holders from months earlier, and that contrast explains much of the hidden strain in the market. The chart shared alongside the analysis illustrates this age-cohort split and suggests a period of supply rotation rather than broad, immediate distribution, a pattern also discussed in recent coverage of XRP's consolidation near key price levels like consolidation near $2.12.
Psychological Pressure on XRP Holders
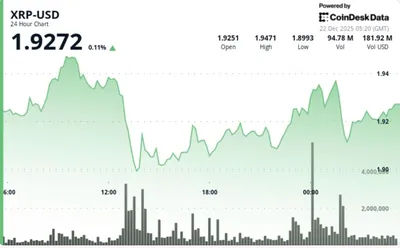
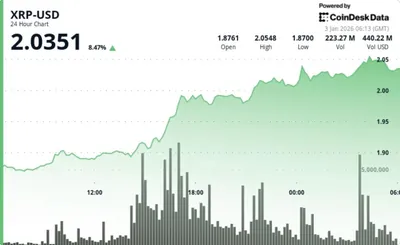
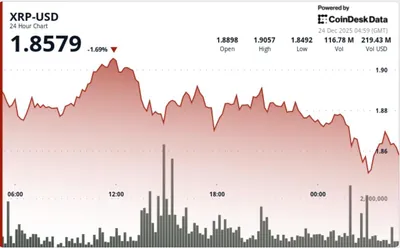
The $2.0 level remains a major psychological zone for Ripple holders and underpins much of the observed behavior. Glassnode notes that since early 2025 each time XRP has retested $2 investors have realized between $0.5B and $1.2B per week in losses, a pattern that reinforces caution among sellers. In practice, repeated loss realization at this threshold can suppress confident selling and reshape participation until either liquidity or sentiment shifts.
Supply Rotation and Market Implications
Supply rotation, as described by Glassnode, occurs when newer investors absorb liquidity from older holders instead of the market seeing aggressive distribution by long-term holders. That dynamic often happens during prolonged consolidation, when spot prices trade in a tight range and volatility is muted. Observing who is holding and at what realized prices helps explain where selling pressure may or may not appear, and related reporting on current market indicators can add context to these flows.
Future Outlook for XRP
The configuration Glassnode describes has appeared in past XRP cycles and has preceded different outcomes depending on liquidity and sentiment. In some historical instances similar setups were followed by sharp downside moves, while in others they preceded renewed expansions once participation shifted toward recent entrants. What matters for the market is how cost-basis stress and psychological thresholds interact with available liquidity and trader conviction.
Why this matters
For holders and participants, the key takeaway is that apparent calm in price can mask accumulating stress among holders with differing cost bases. The $2.0 level is not only a round number on a chart but a point where repeated loss realization has already affected behavior, making it a practical reference for trading and risk decisions. Understanding which cohorts are underwater and where recent buyers sit helps explain why volatility may remain subdued until those imbalances resolve.
What to do?
If you run mining equipment in Russia and manage between one and a thousand devices, focus on practical risk management rather than trying to anticipate specific moves. Track your own cost basis and weekly cashflow needs, and avoid making large, emotion-driven sales solely because a psychological level is under pressure. Stagger any planned sales, keep an eye on realized-loss signals from onchain analytics, and adjust operational costs or power schedules to preserve liquidity during extended consolidation.
FAQ
Why is XRP’s current market structure important? Glassnode's data shows a repeat of a 2022-style setup in which short-term holders accumulate below longer-term cost bases, a configuration that can create hidden stress before price moves.
What does supply rotation imply for price action? Supply rotation suggests newer investors are absorbing liquidity from older holders rather than mass selling, a pattern common during extended consolidation prior to broader volatility changes.
Why is the $2 level critical for holders? The $2.0 level functions as a major psychological zone; since early 2025, retests of that level have coincided with $0.5B–$1.2B per week in realized losses, which influences spending behavior.
How can cost-basis stress affect future performance? Rising psychological pressure on underwater holders can suppress short-term selling, and historically similar conditions have preceded either sharp breakouts or breakdowns depending on liquidity and sentiment.