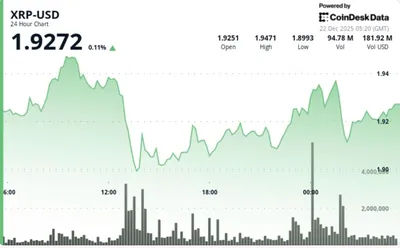
XRP approached the $2.00 mark on December 21, 2025, but failed to hold above this level. At the time of writing, the price stood at $1.91, reflecting a weak rebound after several weeks of consecutive lower highs and gradually lower lows. This market structure indicates the need for confirmation before a sustained upward move can be expected.
Current XRP Price Situation
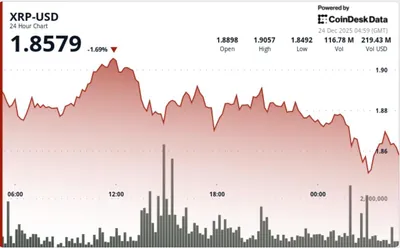
On the hourly chart, the asset is trading within a narrow corridor between $1.89 and $1.96, where an attempt to break the upper boundary was quickly rejected. This short-term "bullish" move proved limited and triggered a strong red candle after failing around $1.94–$1.96. Under such conditions, traders should wait for a clear candle close above $1.96 to talk about momentum recovery.
XRP Chart Analysis
On the 4-hour timeframe, a strong rebound is visible from approximately $1.774 to $1.96, accompanied by rising volume — a classic liquidity sweep and temporary recovery signal. If the price can hold the $1.88–$1.90 zone as support, there is a chance to form a higher local low and a short-term bullish structure. Meanwhile, the daily chart remains in a downtrend: the asset has slid from highs of $2.31 to $1.77, and the recent rebound failed to break resistance around $2.00–$2.05.
You can explore previous declines and corrections in more detail, including the recent drop, in the article on the fall to $1.85, which discusses related levels and market reactions. This helps to understand how the current situation fits into the recent price structure.
Technical Indicators
Momentum indicators lean bearish: momentum at -0.13290 and MACD around -0.07719, casting doubt on an imminent continuation of growth. At the same time, RSI 40.73, Stochastic 35.31, and ADX 22.89 sit in a neutral zone, indicating no clear trend and the need for further confirmation.
Key moving averages — EMA and SMA over various periods — show bears in control, with the 200-period SMA at $2.58747 significantly above the current price. For a deeper dive into signals, see the technical analysis featuring alternative scenarios and different timeframes.
XRP Forecasts
Bullish Scenario
Bulls will gain a clear advantage with a confident close above $1.96 followed by a move back above $2.00 on strong volume. This could trigger a short-term rally micro-scenario targeting around $2.15–$2.25, provided volume confirms the momentum and resistance turns into support.
Bearish Scenario
If the price fails to hold support near $1.88, it could lead to retesting the low around $1.77 or even lower, continuing the broader downtrend. As long as key moving averages remain bearish, any rallies risk being corrective rather than the start of a sustained uptrend.
Why This Matters
For miners operating between 1 and 1000 devices, this news primarily signals asset volatility and that the price currently offers no stable growth signals. Short-term attempts to rise may create profit-taking opportunities, but without confirmed closes above key levels, the risk of pullbacks remains high.
If your income depends on XRP’s price, it’s useful to monitor the $1.88–$1.90 holding zones and the reaction near $2.00; if supports fail, it’s wise to plan ahead for capital preservation and asset rotation. For a broader picture and long-term forecasts, consult other materials including price reviews and predictions.
What to Do?
For small and medium miners, keeping an action plan simple is beneficial: set rules for profit-taking and loss limits based on local levels $1.88 and $1.96. If the price holds above $1.96 on good volume, consider partial position increases but only with clear stop-losses.
In case of a drop and loss of support near $1.88, prepare for a test of $1.77: review electricity costs and possible equipment maintenance schedules to reduce risks during prolonged declines. Continuous monitoring of volume and candle closes will remain key decision-making tools.
FAQ
What is the current price of XRP? As of December 21, 2025, XRP trades at $1.91, with an intraday range around $1.89–$1.96.
What do technical indicators show? Momentum and MACD lean bearish (momentum -0.13290, MACD -0.07719), while RSI 40.73, Stochastic 35.31, and ADX 22.89 remain neutral.
What are the key support and resistance levels? Supports are around $1.77–$1.88, resistance near $2.00–$2.05; a crucial short-term barrier is $1.96 on the hourly chart.
What confirms a bullish breakout? A confident hourly candle close above $1.96 on confirming volume would signal strengthening bullish momentum.