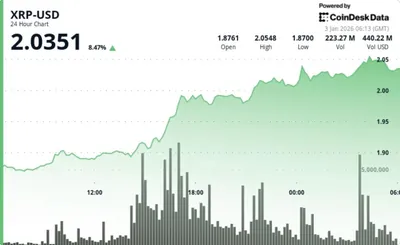
XRP’s early‑2026 momentum stalled on Jan. 8 when the token slipped below the $2.10 level, briefly finding an intraday floor at $2.06 before a modest recovery to $2.10. This price action coincided with the first recorded net outflows from XRP spot ETFs, totaling approximately $41 million, which coincided with the pullback in market sentiment.
XRP Price Drop and Market Correction
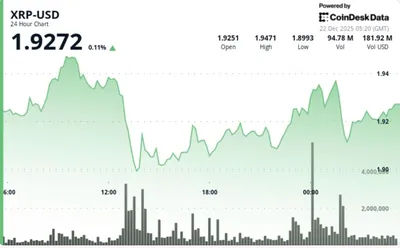
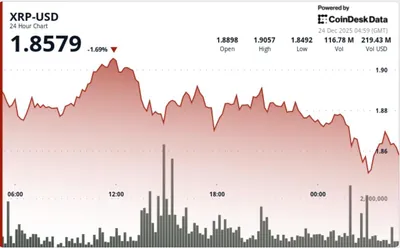
The retreat below $2.10 erased most of the gains accumulated during the first days of the year and marked a sharp deceleration of bullish momentum. According to Bitstamp data, the intraday low of $2.06 occurred before buyers pushed the price back toward the $2.10 handle, illustrating a volatile intraday session. Two days earlier, XRP had peaked at roughly $2.41, a high that boosted its market capitalization to $144 billion and helped lift the total crypto economy above the $3.3 trillion level.
Technical Indicators and Market Sentiment
Short‑term technicals moved into bearish territory on Jan. 8, signaling increased selling pressure and a loss of upward conviction. Traders noted a sharp drop in momentum indicators and several moving averages slipping into resistance roles, which together painted a more cautious picture for near‑term price action.
- 14‑day RSI: 28.43, placing the asset in oversold territory.
- MACD: sell signal with a value of -0.038 on Jan. 8.
- Moving averages: price slipped below the 200‑period moving average, while the 14‑day SMA is acting as overhead resistance.
Broader Market Impact
The sharp reversal from the Jan. 6 peak shifted short‑term momentum from bullish to corrective, removing much of the early‑year euphoria. The correction followed the ETF flows and technical deterioration, and it trimmed the gains that had pushed XRP’s market cap to $144 billion. Market participants saw the episode as a reminder that ETF flows and technical structure can quickly change near‑term dynamics.
Почему это важно
Если вы майните и держите XRP в своём портфеле, падение под $2.10 и одновременные оттоки из ETF означают усиление волатильности, которая может влиять на стоимость монет, которыми вы располагаете. При этом краткосрочная просадка не затрагивает сам процесс майнинга, но снижает рыночную цену добытых токенов и может увеличить волатильность при конвертации в рубли.
Для майнера с 1–1000 устройствами это означает, что момент выхода с рынка, плановые продажи и конвертация валюты требуют более внимательного подхода: резкие колебания цены могут снизить доходность в рублях в короткие промежутки времени, даже если хешрейт и добыча остаются стабильными.
Что делать?
Контролируйте экспозицию: при повышенной волатильности распределяйте продажи по частям и используйте лимитные ордера, чтобы уменьшить риск реализации по убыточным ценам. Установите уведомления о ключевых уровнях цены и технических индикаторах — это поможет оперативно реагировать на резкие движения.
Следите за ликвидностью и потоками из ETF: для подробного разбора оттоков можно посмотреть ETF outflows report, а общие рыночные итоги и текущие показатели доступны в price and market analysis. Если вы предпочитаете пользоваться техническим подходом, посмотрите предшествующий прорыв и сопротивления в обзоре breakout above $2.12, чтобы понять возможные уровни реакции цены.