Over the last hour on Jan. 14, 2026, XRP traded between $2.14 and $2.17, staying inside a tight intraday band of $2.08 to $2.18. The token’s market capitalization was $130 billion while 24-hour turnover reached $5.16 billion, showing active participation across venues. Notably, XRP/KRW volumes surged and accounted for nearly 13% of South Korea’s crypto market activity, drawing attention to regional liquidity dynamics.
Current XRP Price and Market Overview
Price action on the day remained compact, with the most recent hourly prints at $2.14–$2.17 and the full intraday spread between $2.08 and $2.18. Market cap and daily volume figures reinforce that XRP was trading with meaningful liquidity, and the South Korean peso pair contributed a sizable share of activity. Traders are watching the $2.05 level for support and the $2.18 area for near-term resistance as the session progressed.
Surge in XRP/KRW Trading Volume
Trading in the XRP/KRW pair picked up materially, capturing nearly 13% of South Korea’s crypto market activity and boosting regional liquidity for the token. That concentration of volume can shorten fills and amplify short-term moves, so participants on any venue may notice tighter spreads or sharper intraday swings. For context on recent price behavior and market positioning, see the piece on current indicators highlighted by local flows.
Technical Analysis: Daily Chart
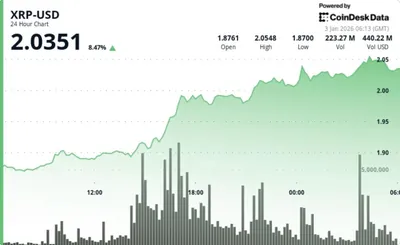
On the daily timeframe, XRP rebounded from the $2.05 support, with an accompanying uptick in volume that flagged renewed buying interest after the prior correction. Price action is moving toward a retest of $2.20, with a broader upside zone noted between $2.35 and $2.41 as the next area of resistance. Market participants remain focused on volume to confirm any sustained push beyond these levels; for a deeper read on the potential higher target, refer to the analysis about a possible breakout to $2.41.
Technical Analysis: Four-Hour Chart
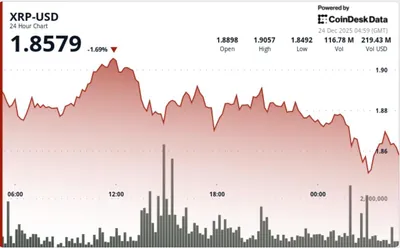
The 4-hour chart recorded a rejection at $2.18 and the formation of a rounded bottom, accompanied by increasing green-candle volume—an arrangement that suggests a compressed setup with breakout potential. Price has been squeezing between roughly $2.12 and $2.18, and a decisive move above $2.18 could open a path toward $2.25, while a failure could see a return toward $2.08. Traders should treat short-term breakouts with confirmation from volume to avoid false moves.
Technical Analysis: One-Hour Chart
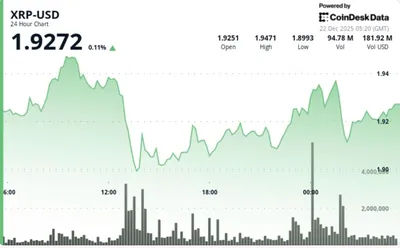
On the hourly timeframe, XRP recovered from $2.045 up to $2.188, then pulled back and printed a bullish engulfing candle to close the hour, creating a sequence of higher highs and higher lows alongside rising green-volume bars. Ideal intraday entry zones were identified between $2.14 and $2.16, with scalpers looking at sub-targets around $2.25 for quick exits. This timeframe shows the clearest short-term bullish structure among the charts.
Oscillators and Indicators
- RSI: 57.3
- Stochastic oscillator: 51.2
- CCI: 62.6
- ADX: 29.4
- MACD: 0.0426
Most oscillators sit in neutral-to-mildly-bullish territory, with the ADX indicating trend strength without dominance and the MACD offering a subtle nudge toward continuation. These readings together suggest momentum is present but not yet overwhelming, so confirmation from price and volume is still desirable before committing to larger positions.
Moving Averages Analysis
- EMA support area: $2.05–$2.08
- SMA 10-period: $2.15
- 100- and 200-period EMAs/SMAs: bearish divergence noted
The shorter EMAs are clustered under the current price and offer near-term support in the $2.05–$2.08 band, while the 10-period SMA sits near $2.15 and acts as a nearer-term reference. Longer-period EMAs and SMAs show bearish divergence, so the short-term optimism sits against a longer-term cautious backdrop; traders tracking break levels may also find the discussion about a potential break above $2.12 useful.
Bullish and Bearish Verdicts
Short-term charts (1H and 4H) favor the bulls: rising volume, higher lows, and aligned short EMAs support a continuation above immediate resistance if volume confirms. A breakout above $2.18 is the key near-term trigger that could open tests of the $2.35–$2.41 area on the daily chart.
On the other hand, longer-term moving averages display bearish divergence, and oscillators are not decisively extreme, which argues for caution. Without a convincing breakout accompanied by sustained volume, price could revisit the $2.05 support or remain range-bound.
Why this matters (for miners in Russia)
For a miner operating in Russia with anywhere from one to a thousand devices, these price and volume details matter mainly in liquidity and timing terms. Higher trading volume—especially concentrated flows like the XRP/KRW surge—can make it easier to sell mined coins without wide slippage, while tight intraday ranges mean shorter windows for profitable timed sales. At the same time, short-term bullish structures do not change electricity costs or mining yields, so operational decisions remain separate from these market signals.
What to do?
- Monitor key price levels: watch $2.05 as support and $2.18 as near-term resistance before deciding on sales or holds.
- Use volume as confirmation: prefer selling into confirmed breakouts or increased volume to reduce the chance of poor fills.
- Set pragmatic risk rules: if you use stop-losses, place them with consideration for the $2.05 support band to avoid whipsaws.
- Adjust sell cadence by size: for small rigs, consider scaling out across sessions; for larger operations, spread sales to reduce market impact.
- Keep an eye on short-term indicators and moving averages to time entries and exits rather than relying on long-term divergence alone.