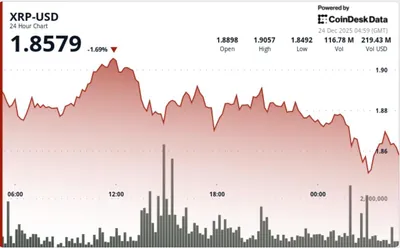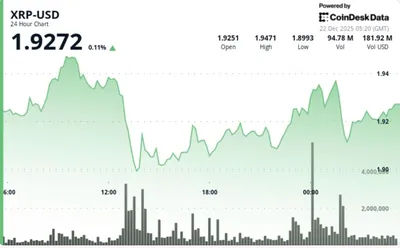
If you hold XRP and were hoping for a rapid return to $2, recent technical signals temper that expectation. The XRP daily Bollinger Bands on the XRP/USDT chart are showing warning signs: the price is persistently below the indicator’s middle line, which currently sits around $0.52. This setup discourages optimism for a near-term surge unless the chart shows clear confirmation of a trend change.
Understanding the XRP Daily Bollinger Bands
Bollinger Bands consist of an upper and lower band around a moving average and help gauge volatility and momentum. On the daily XRP/USDT chart the critical detail is that the price is trading below the bands’ middle line, a simple moving average that often acts as the baseline for bullish momentum. Staying beneath this middle line typically reflects insufficient buying pressure to sustain a significant rally, so the indicator here signals caution rather than strength.
Why $2 is Unlikely for XRP This Year
The analysis identifies a clear technical barrier to any fast move back to $2: XRP must first reclaim and hold above the Bollinger Bands’ middle line near $0.52. Without a sustained break above that level, the path to higher targets remains blocked by the current bearish alignment of the bands. For further context on XRP price dynamics and longer-term forecasts, see our review of XRP: price and forecast.
Conditions for a Bullish Reversal
A genuine trend change would require a specific sequence on the daily chart rather than an isolated uptick. The most immediate and vital sign would be a strong, high-volume daily close above the Bollinger Bands’ middle line around $0.52, showing buyers have overcome sellers at that level. Even with such a close, the analysis implies caution: the bands’ current bearish alignment means further confirmation would be needed before calling a durable reversal.
Почему это важно
Если вы майните в РФ и у вас от одного до тысячи устройств, техничeская картина влияет на решения по хранению и продаже монет, даже если напрямую не меняет расход электроэнергии. Торговая статистика и давление продавцов определяют ликвидность: в периоды слабости цены может быть сложнее быстро продать крупные объёмы без скидки. При этом отсутствие роста до $2 снижает шанс на быструю прибыль от накопленных выплат, что важно учитывать при планировании ротации средств и бюджета на оплату электроэнергии.
Что делать?
Для майнера с небольшим или средним парком устройств разумный подход — не принимать скоропалительных решений на основе одного индикатора. Следите за ежедневным закрытием цены относительно $0.52 и за объёмом торгов: только уверенный, высокообъёмный дневной закрытие выше этой линии можно считать первым техническим сигналом к изменению тренда. Пока таких подтверждений нет, стоит рассматривать период как время наблюдения и паспорта управления рисками, а не момент для агрессивных покупок.
Actionable Insights for Traders
Manage expectations: the current Bollinger Bands setup makes a rapid move to $2 unlikely without a clear technical turnaround. Wait for confirmation rather than trading on hope — a sustained, high-volume daily close above $0.52 would be the initial green light to reconsider a bullish stance. Until that confirmation appears, a cautious approach with risk controls is advised.
Frequently Asked Questions
What are Bollinger Bands and why do they matter for XRP? Bollinger Bands plot volatility around a moving average; the middle line is typically a 20-period simple moving average. For XRP, the bands help show whether momentum is shifting and whether volatility is expanding or contracting, with the middle line serving as an important reference for bullish momentum.
Does the bearish signal mean XRP will keep falling? The signal points to continued bearish pressure or consolidation in the near term but is not a guaranteed prediction of ongoing declines. It indicates a higher probability of sideways or downward moves until a clear technical reversal occurs.
What price must XRP break to change the outlook? The primary level to watch is the Bollinger Bands’ middle line, around $0.52; a decisive, high-volume daily close above that level is described as the first technical requirement for a potential trend change. Only after such confirmation would the chart begin to allow consideration of higher targets.
Should I sell my XRP based on this analysis? This is not financial advice. The analysis recommends managing expectations for a rapid $2 recovery and waiting for chart confirmation; any decision to sell or hold should align with your own strategy, tax situation, and risk tolerance.
Can external news override this technical picture? Significant external events can change market sentiment and capital flows, which may temporarily override technical indicators. Technical analysis reflects current price action and should be considered alongside news and fundamental developments.
How often should I check the XRP daily Bollinger Bands? For swing or position traders, checking the daily chart at the close of the trading day is usually sufficient, since the daily timeframe filters intra-day noise and gives a clearer view of the prevailing trend.
For additional technical context on recent price movements, you may find the discussion in the price drop analysis useful.