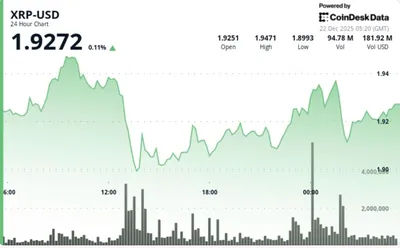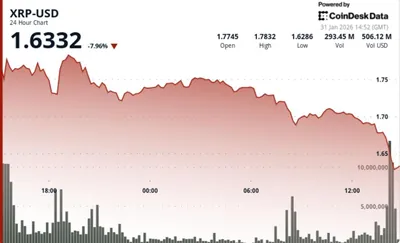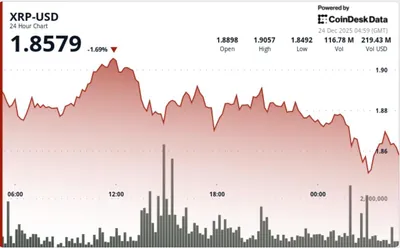
At 1:21 p.m., XRP was trading at $1.8452 after a steady slide from the $1.92–$1.93 area earlier in the session. Selling pressure accelerated in the latest candles, pushing price through the lower end of its recent consolidation and toward session lows. Multiple failed attempts to hold the $1.92–$1.93 zone set up a clear rollover into a trending decline.
XRP Price Plummets Amid Market Turmoil
The breakdown moved XRP below its consolidation range and into a more decisive bearish structure, with momentum tilted to the downside as the session progressed. Volume expanded notably during the drop from above $1.90 to the session low, supporting the view that this is a continuation rather than a brief gap lower. For background on the earlier range failure and the initial break, see break below $1.93 which traces the setup that led into today’s decline.
Technical Indicators Confirm Bearish Trend
Momentum gauges underline the sellers’ control: the Relative Strength Index has slid to roughly 23, placing momentum deep in oversold territory. The MACD remains below the zero line, with the MACD line sitting under the signal line and the negative histogram bars expanding, a configuration that reflects strengthening downside momentum rather than stabilization. From a trend perspective, price trades below both the 50-period and 200-period simple moving averages while Bollinger Bands have widened and price is hugging the lower band near the mid-$1.80s, indicating elevated volatility.
Macro Forces Exacerbate XRP’s Decline
Broader risk sentiment deteriorated as trade tensions escalated after President Donald Trump threatened sweeping tariffs on Canadian exports, a development that has added to geopolitical uncertainty. That deterioration pushed traders toward defensive positions and away from volatile assets, amplifying selling pressure on XRP and similar tokens. The move followed earlier trade rhetoric that contributed to a cautious market tone heading into the new week.
Key Support and Resistance Levels
Traders are watching the $1.85 area as immediate support; a failure to attract buyers there would keep the short-term bias pointed lower. Any recovery attempt would first need to clear resistance near $1.88 and $1.90, then contend with the declining moving averages above. For more on nearby technical thresholds and support dynamics, readers can consult the piece on support $1.87, which discusses adjacent levels and how they relate to ongoing price action.
Why this matters
If you hold XRP or have exposure to it, the recent drop reduces the market value of those positions and raises near-term volatility. For miners and small operations in Russia with limited liquidity, such swings can make converting crypto receipts into fiat less predictable and increase the importance of cash-flow planning. Even if you do not hold XRP directly, intensified risk-off episodes can tighten liquidity across crypto markets and affect trading conditions for many assets.
What to do?
- Monitor the $1.85 support area and set price alerts around $1.88–$1.90 to catch potential bounces or failed recoveries.
- Watch RSI and MACD readings before making decisions: RSI near 23 signals oversold conditions, but MACD still indicates downside momentum.
- Avoid panic selling; decide in advance which price levels would trigger rebalancing or partial exits based on your risk tolerance.
- Consider reducing exposure if you need fiat to cover operating costs and cannot afford large paper losses during volatile episodes.
- Keep an eye on trade and geopolitical headlines that can shift risk appetite quickly, and adjust position sizes rather than chasing short-term moves.