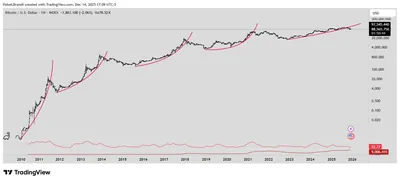
Veteran trader Peter Brandt posted on social platform X on Jan. 25, 2026, flagging a completed bear channel on Bitcoin and describing it as another sell signal that keeps downside risk dominant. He emphasised that price would need to reclaim $93K to negate the bearish structure, while also outlining a deeper target range of $58K–$62K as a possibility.
Peter Brandt's Bitcoin Sell Signal
Brandt described the recent pattern as a completed bear channel, which in his framework signals continuation pressure rather than an immediate reversal. He stressed the importance of the $93K level: unless Bitcoin climbs back above that threshold, the broader bearish interpretation remains in place, and shorter-term rising attempts can fail to change the overall view.
His commentary reflects a classical charting approach where patterns can “morph,” meaning a structure that looks bearish can later change, and vice versa. Brandt explicitly frames his views as probabilistic rather than definitive, noting the possibility of being wrong and treating scenarios as risk markers.
Technical Levels and Resistance
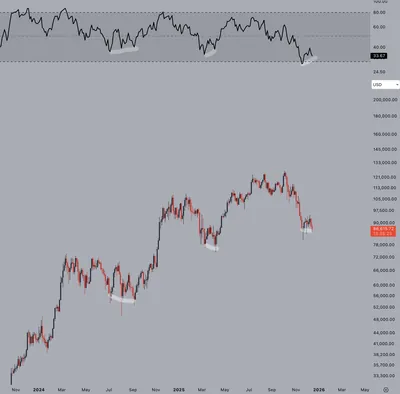
The chart Brandt shared showed price trading below declining moving averages and capped by a longer-term descending trendline near $107,482, with a former support zone around $98,900 appearing to act as resistance. A narrower rising structure into January failed, which reinforced the bearish framework unless the $93K threshold is reclaimed.
For readers who want a broader map of important thresholds, see the key levels and scenarios that put these resistances in context alongside other pivot points traders watch.
Downside Scenarios and Support Zones
Brandt highlighted a potential move to $58K–$62K as where he thinks Bitcoin could head if the bearish structure plays out. The same chart also marked intermediate potential support near $81,833 and lower support around $66,883, which would matter if price continues downward pressure.
These ranges serve as measured reference points for downside scenarios rather than guaranteed targets, and they sit alongside earlier analyses that discussed larger fall risks, such as the risk of $50,000 that has been debated in other forecasts.
Market Uncertainty and Countervailing Forces
Brandt openly acknowledged uncertainty in his calls, writing that he is wrong about half the time and that charts can change shape. That admission underlines his probabilistic approach: he offers scenarios to mark risks rather than make firm predictions.
Historically, bearish projections have sometimes been invalidated by abrupt market moves driven by factors such as liquidity shifts, derivatives positioning resets, and renewed spot demand. Those dynamics mean Brandt’s levels act as guides to risk rather than certainties.
Why this matters
If you run mining equipment, the technical picture Brandt outlines is primarily a signal for price risk, not an immediate operational change. A continued downside trend would reduce revenue per BTC when you sell mined coins, while reclaiming $93K would remove the bearish chart backdrop and potentially ease short-term selling pressure.
Even if the chart work does not force a direct action, it helps set a planning horizon: prepare for a lower-price scenario around the ranges Brandt mentions, and keep an eye on the $93K level as a practical indicator that the technical structure has shifted.
What to do?
Below are concise, practical steps for miners with between one and a thousand devices. These are intended to manage operational and financial risk without presuming any one market outcome.
- Set price alerts at $93K and for the $58K–$62K range so you know when key thresholds are approached.
- Review your sell cadence: consider whether to convert mined BTC to fiat regularly or hold through volatility, based on your costs and liquidity needs.
- Stress-test your operations for lower-price scenarios (e.g., check margins at support zones near $81,833 and $66,883) to understand how long you can run profitably.
- Keep maintenance plans and spare parts ready so short-term price moves don’t force fire sales of equipment.
- Follow updates to the technical picture rather than a single post; if price reclaims $93K, the bearish structure Brandt flagged would be negated.
FAQ
What sell signal did Peter Brandt identify on Bitcoin? He pointed to a completed bear channel on Bitcoin charts, describing it as another sell signal that supports downside risk.
Why is $93,000 important for Bitcoin’s chart? Brandt said that price needs to reclaim $93K to negate the current bearish structure and relieve the continuation pressure implied by the completed channel.
What resistance and support levels did he highlight? He noted resistance near $98,900 and $107,482, and potential support zones around $81,833 and $66,883. He also mentioned a possible move to $58K–$62K as a deeper scenario.
How certain are these views? Brandt framed his analysis probabilistically and stated that he is wrong about 50% of the time, treating his scenarios as risk markers rather than predictions.