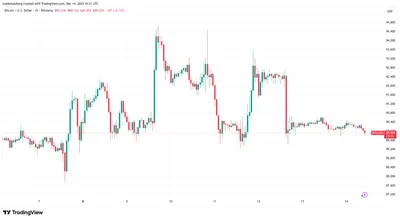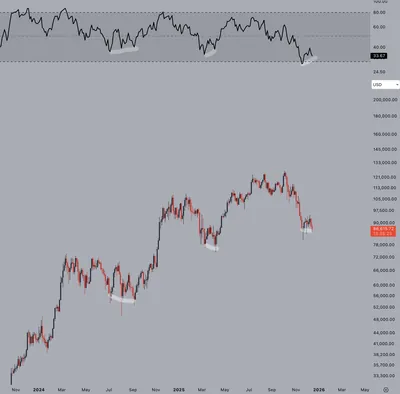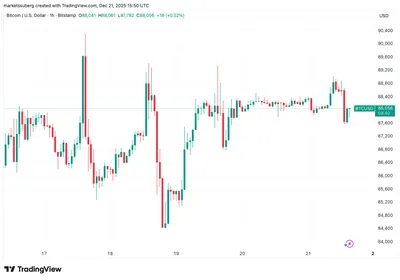
Bitcoin faces a clear technical risk: a weekly dead cross on its chart could open the way to a fall toward $67,000 if the pattern holds. Crypto analyst Gamza Khanzadaev warns that failure to reclaim the $90,000 level before the weekly candle closes would cement a bearish dead cross. Traders and holders are therefore watching a handful of price thresholds and moving averages that define the medium-term outlook.
Bitcoin Price Prediction: The Dead Cross Warning
The dead cross is a chart pattern that appears when a shorter-term moving average crosses below a longer-term one, and on the weekly timeframe it signals possible medium-to-long-term weakness. Khanzadaev’s analysis highlights the 50-week and 200-week moving averages as the lines whose interaction could confirm such a regime shift. In practical terms, the immediate price levels to watch are:
- $90,000 — the reclaim level that would prevent confirmation of the weekly dead cross.
- $86,000 — a key support zone where a decisive break would increase downside risk.
- $80,000 — a psychological support that could be invalidated by a sustained drop below $86,000.
- $74,111 — a deeper retracement target mentioned by the analyst if $80,000 fails.
- $67,000 — the larger-risk target tied to the persistence of the dead cross.
The situation around $86,000 is particularly urgent because a clear break there could trigger selling pressure that reaches the lower targets listed above. For context on scenarios that emphasize an $80K retest, see the analysis of a possible retest $80,000. Market participants are also watching weekly close levels to judge whether the dead cross becomes confirmed.
Understanding the Technical Landscape for BTC
Moving averages are widely used to smooth price action and indicate trend direction; in this case, the 50-week and 200-week averages are central to the debate. A cross of the 50-week below the 200-week on the weekly chart constitutes the dead cross cited by Khanzadaev, and traders often treat such a crossover as a sign of shifting momentum. At the same time, analysts combine moving averages with volume and support/resistance to assess the strength of any move.
Volume matters because a price break without supporting buying or selling volume is less reliable. The raw analysis notes a lack of strong buying pressure at critical levels, and that absence can amplify downside risk if technical supports fail. Therefore, both the position of the averages and the accompanying volume profile shape the market’s reaction.
Contextualizing the Analysis in the 2025 Crypto Market
The commentary places this technical setup into a broader 2025 market backdrop, pointing out that regulatory developments, institutional flows and macro factors influence how technical signals play out. While technical patterns alone do not determine price, they interact with these external factors to produce different outcomes. Readers interested in scenario planning for 2025 can compare this view with other outlooks such as the December 2025 forecast.
Historical precedent shows Bitcoin has formed and recovered from dead cross patterns before, with outcomes varying depending on market conditions at the time. That mixed history underlines why confirmation (for example, by a weekly close) and additional market evidence are important before treating the dead cross as a decisive signal.
The Role of Moving Averages in Crypto Forecasting
The 50-week and 200-week moving averages are long-term trend indicators used by both retail and institutional participants. When price stays above the 200-week average it is often interpreted as a bull-regime characteristic, while a drop of the shorter average below the longer one raises concern about a regime shift. These averages lag price action, so they tend to confirm trends rather than predict them.
Because moving averages are lagging, analysts use them alongside other tools—momentum indicators, on-chain metrics and support/resistance—to form a fuller picture. In the present analysis the interaction of the 50-week and 200-week averages is a trigger metric, but volume and price reaction at $86,000 and $90,000 are the confirming elements.
Key Takeaways and Investor Considerations
The headline risk is straightforward: if Bitcoin fails to reclaim $90,000 ahead of the weekly close and the 50-week crosses below the 200-week, the technical setup could expose BTC to a move toward $67,000. A decisive break below $86,000 would put $80,000 and then $74,111 into focus, according to the cited analysis. Conversely, reclaiming and holding above $90,000 would prevent the dead cross confirmation and reduce this particular downside scenario.
Why this matters for miners in Russia
If you run mining hardware in Russia, this kind of technical risk can affect short-term revenue and liquidity even if it does not change your fundamentals. Price weakness compresses fiat proceeds from coin sales and can make margins tighter when power and maintenance costs remain fixed. At the same time, a confirmed technical downtrend can influence decisions about when to sell mined BTC versus holding for a potential recovery.
What to do — practical steps for miners
For miners managing one to a thousand devices, focus on liquidity and simple risk controls. Consider keeping a portion of mined coins as reserve rather than converting all to fiat immediately, and review cash-flow needs to cover power and upkeep if prices dip toward the cited support levels. Also monitor the weekly close around $90,000 and volume behavior at $86,000; these are the technical triggers highlighted by the analysis.
- Track weekly closes relative to $90,000 and the position of 50-week/200-week averages.
- Prepare for lower realized prices by ensuring reserves cover operational costs for several weeks.
- Use stop-losses or staged selling if you rely on regular fiat flow from mining revenue.
Technical analysis provides a framework, not certainty. Treat the dead cross warning as one input among many and align any operational or selling decisions with your tolerance for price swings and short-term cash needs. This page does not offer trading advice; perform independent research before making financial decisions.