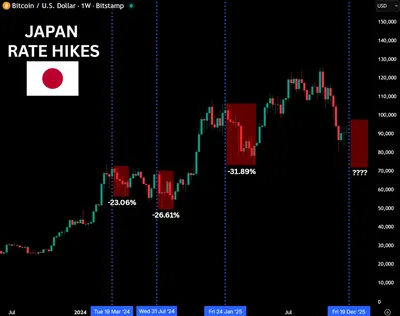
Bitcoin's recent price weakness has increased the likelihood of a correction to around $70,000. However, analysts emphasize that such a decline would represent a macroeconomic reset rather than the onset of a new bear market. The downside risk is generally seen as centered between $65,000 and $75,000, a range that has historically served as a strong buying opportunity for investors.
Current Bitcoin Price Correction and Market Sentiment
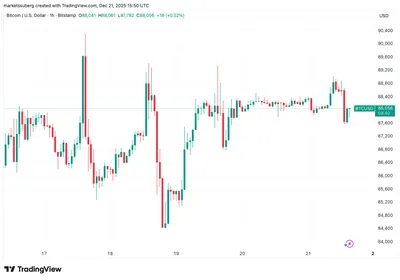
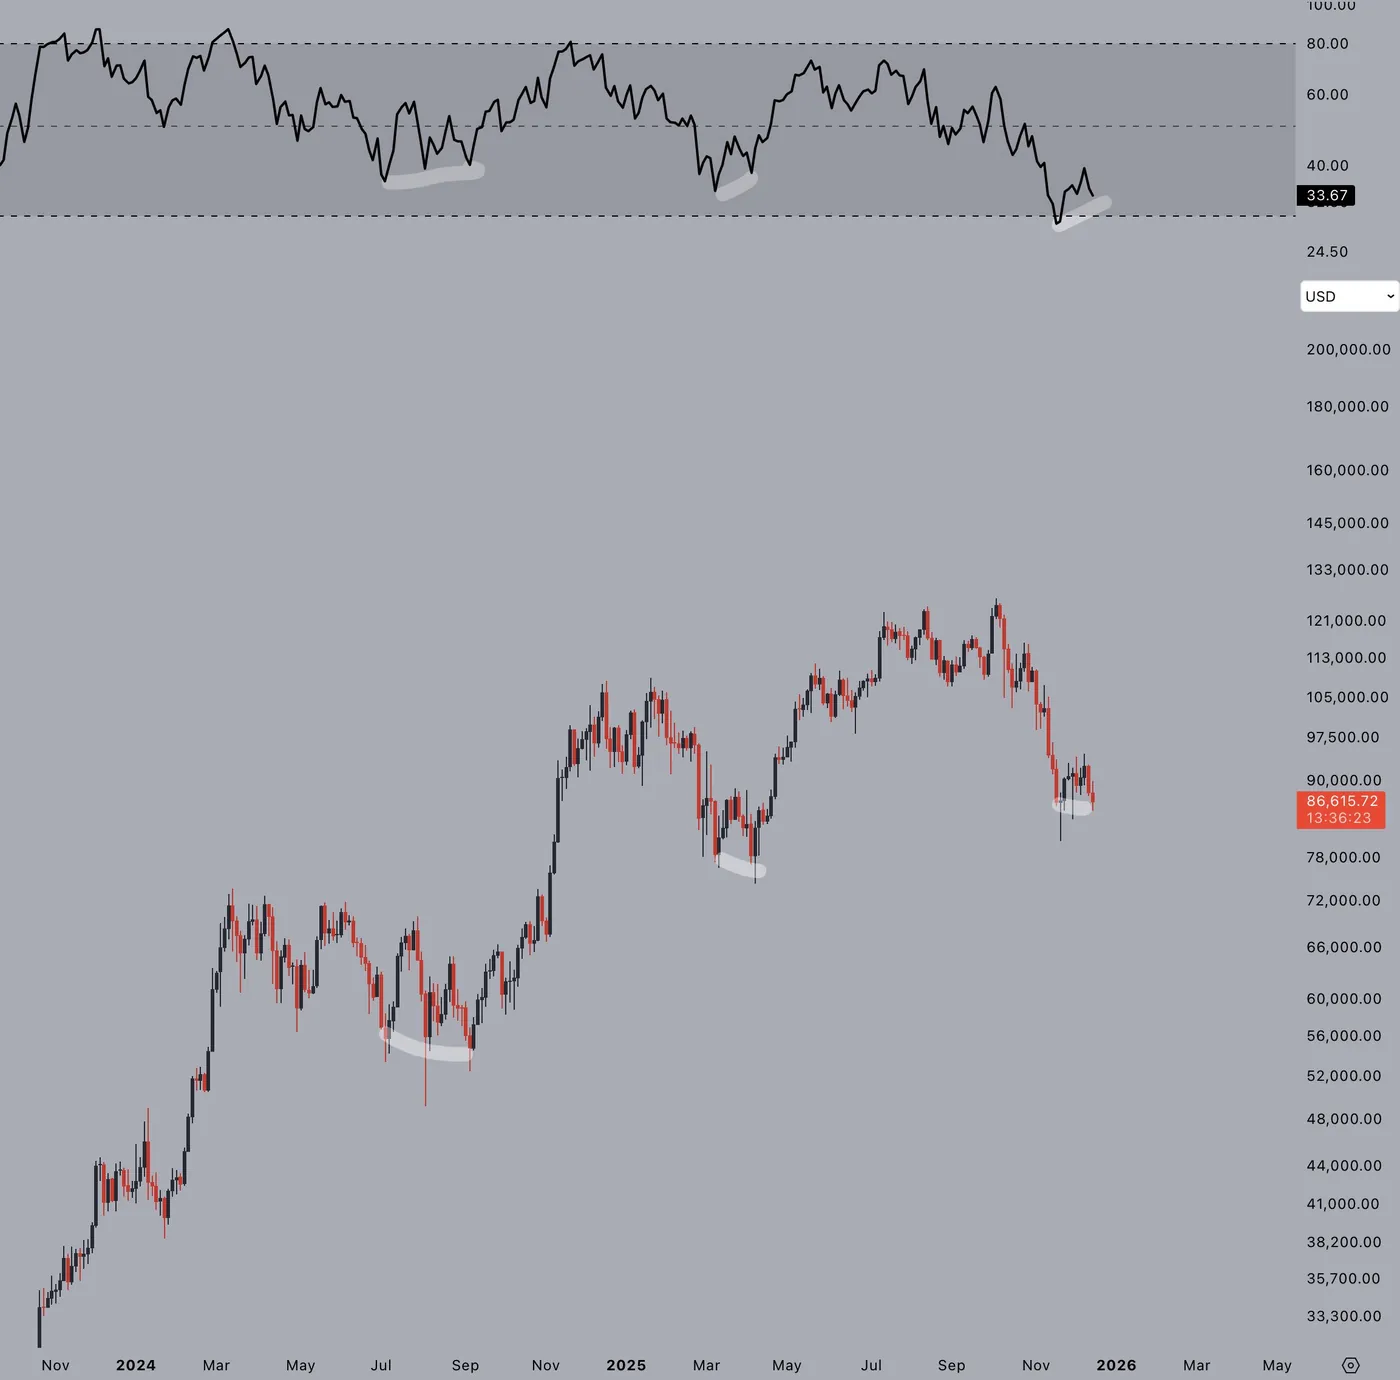
Market participants observe that the current price action reflects a rotation of supply from early holders to institutional investors, rather than systemic macro-driven risk-off pressure seen in previous downturns like those in 2022 or early 2024. This supply rotation contributes to the ongoing correction, which remains within a macroeconomic range for 2025. Additionally, technical analysis points to a potential three-day bullish divergence forming on Bitcoin's chart, a pattern that has coincided with local bottoms earlier in the current cycle. While this setup suggests momentum may soon stabilize, confirmation requires further time and consolidation.
Analysts' Views on Market Cycles and Macroeconomic Factors
Crypto trader Jackissaid highlights that even a drop to $70,000 would not mirror prior bear markets but instead fits within the current macroeconomic range. Julien Bittel, head of macro research at Global Macro Investor, supports this perspective by referencing Bitcoin's historical recovery following oversold Relative Strength Index (RSI) readings below 30. According to Bittel, such oversold conditions often precede well-defined recovery paths, though bases typically take time to form and involve choppy price movements before a sustained uptrend resumes. He also notes that the traditional four-year halving cycle no longer dominates Bitcoin's price behavior. Instead, extended debt refinancing cycles and evolving liquidity dynamics are shaping the market structure, which may persist into 2026.
Long-Term Bitcoin Price Projections and Cycle Evolution
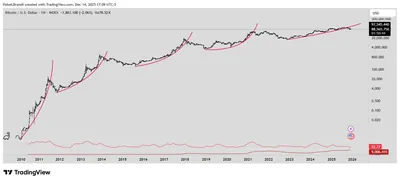
Jurrien Timmer, director of Global Macro at Fidelity, situates the current market phase within a broader wave structure spanning 2022 to 2025, which has delivered a compound annual growth rate (CAGR) of 105% over 145 weeks. While he acknowledges the possibility of a deeper correction into the $65,000 to $75,000 range in 2026, Timmer emphasizes these zones have historically acted as strong buy areas. Looking further ahead, he expects future Bitcoin cycles to feature flatter slopes as adoption matures. Nonetheless, price modeling suggests a potential trajectory toward $300,000 by 2029 if a new expansion phase emerges. In this context, current corrective phases may serve as foundations for Bitcoin's next structural price advances.
Technical Indicators and Their Implications
Technical signals reinforce the constructive outlook amid the correction. The potential three-day bullish divergence noted by analysts has previously aligned with local bottoms in this cycle, indicating that momentum may soon shift. Confirmation of this bullish divergence requires additional consolidation. Moreover, historical patterns show that oversold RSI readings below 30 often precede recovery phases, supporting the view that the current drawdown could mark a base formation. These corrective periods, while accompanied by volatility and choppy price action, are generally part of the process leading to sustained uptrends in Bitcoin's price.
Why This Matters for Miners in Russia
For miners operating in Russia with up to 1,000 devices, understanding that a Bitcoin correction to $70,000 signals a macroeconomic reset rather than a new bear market can help in planning operational and financial strategies. The identified downside risk range between $65,000 and $75,000 offers potential buying or holding zones, which may influence decisions on when to expand or reduce mining capacity. Recognizing that current price movements reflect supply rotation and evolving market dynamics rather than systemic risk can provide confidence to maintain mining activities during this phase.
What Should Miners Do?
- Monitor Bitcoin price movements closely, especially around the $65,000 to $75,000 range, to identify potential buying or holding opportunities.
- Pay attention to technical indicators such as bullish divergences and RSI levels, which may signal local bottoms and recovery phases.
- Plan for continued market volatility and choppy price action, understanding that bases take time to form before uptrends resume.
- Consider the broader macroeconomic context and evolving liquidity conditions when making operational decisions.
- Stay informed about long-term cycle projections to align mining strategies with potential future price trends.