Bitcoin briefly surged past $90,000 on Jan. 28, then retreated to trade between $89,300 and $89,600 as the intraday move settled. At its peak that day the market capitalisation reached $1.78 trillion, reflecting a notable intraday expansion in value.
Bitcoin's $90,000 Breakthrough and Retracement
The price move above $90,000 was short lived, with Bitcoin pulling back into a narrow range after the spike. This intraday behaviour left the market in a consolidation phase as buyers and sellers assessed whether the breakout could hold.
ETF Outflows and Institutional Activity
Spot Bitcoin ETFs flipped to net outflows at the end of the prior trading session, with a reported net withdrawal of $147.37 million on Jan. 26. BlackRock’s IBIT accounted for $102.81 million of those redemptions, yet the price showed resilience despite the institutional outflows.
Structural Shift in Bitcoin Holdings
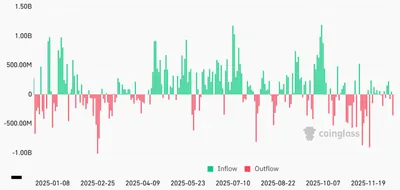
On‑chain data shows monthly transfers to Binance fell to about 5,700 BTC, marking a four‑year low in exchange inflows and a decline of more than half from a historical average of 12,000 BTC. Social commentator Darkfost noted this prolonged weakness in inflows, suggesting the trend may reflect a more structural shift toward long‑term holding.
Technical Landscape and Key Levels
Technically, the market is balancing between short‑term exhaustion and longer‑term support. Staying above the $84,000–$87,000 zone is cited as important for preserving the bullish structure, while the $91,400 moving average remains immediate resistance; the RSI sits near 64.5, in neutral‑to‑bullish territory.
Market Catalysts and Near‑Term Outlook
Market participants are watching broader catalysts as the wedge in price structure resolves, including monetary policy decisions that could shift risk appetite. Traders have identified higher thresholds that would likely change the immediate tone of the market if reclaimed decisively.
Why this matters (for a miner in Russia with 1–1,000 devices)
Lower exchange inflows mean fewer coins are being moved to exchanges for sale, which can reduce short‑term selling pressure and support price stability; for a small‑scale miner this can translate into steadier revenue when you sell mined coins. At the same time, ETF redemptions show that institutional demand can be fickle, so miners should not assume steady large‑scale buying will prop prices up indefinitely.
Technically important levels—support at $84K–$87K and resistance near the $91,400 moving average—give practical thresholds to watch before deciding on sales or holds. The upcoming policy decisions cited by markets can move sentiment quickly, so keeping an eye on macro announcements remains relevant even for local, small operations.
What to do? (practical checklist for Russian miners)
- Monitor support and resistance: track the $84K–$87K support zone and the $91,400 moving average for signs of sustained trend changes.
- Stagger sales: consider phased selling rather than one‑off dumps to avoid selling into short‑term retracements caused by ETF flows.
- Watch exchange inflows: a continued drop in Binance deposits (5,700 BTC monthly) may indicate a supply squeeze—adjust your selling cadence accordingly.
- Keep liquidity for costs: ensure you have reserves to cover electricity and maintenance for at least several weeks in case price volatility narrows profitable windows.
- Follow catalysts: monitor institutional flows and policy announcements that can rapidly change market direction.
For background on recent price behaviour and ETF pressure, see Bitcoin holds near $90K and for technical reasons Bitcoin struggles to clear the $90K area, see why Bitcoin can't break $90K. These pieces offer context on the consolidation and resistance levels discussed above.