Cryptocurrency markets gave back a portion of recent gains after the US trade war with several European countries resumed, prompting some traders to step aside and reduce risk. That short-term risk-off mood weighed on both Bitcoin and many major altcoins, which have rolled down from overhead resistance levels. As a result, analysts and traders are watching key support points closely to assess whether buyers will defend recent levels.
Bitcoin’s pullback is attempting to find support near $92,000, but selling pressure has remained in place and the short-term outlook is uncertain. Network economist Timothy Peterson said he expects BTC to eventually catch up with gold’s rally, while trader CrypNuevo warned that uncertainty could push BTC lower. The 2026 yearly open of about $87,000 and the range lows near $80,500 are highlighted as critical levels to watch going forward.
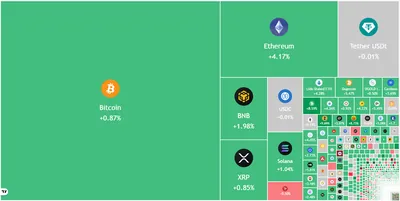
Market Overview and Bitcoin Analysis
The resumed US–EU trade tensions created a risk-off backdrop that trimmed gains across the crypto market and supported metals like gold and silver. In this environment, many altcoins turned down from their resistance areas, signaling that bears remain active at higher prices. For readers who want scenario-based Bitcoin levels and follow-up analysis, see BTC levels and scenarios for a focused breakdown of possible moves.
S&P 500 Index Price Prediction
The S&P 500 is facing selling pressure near the 7,000 level, although bulls have not surrendered much ground to the bears. A decisive move below short-term support would be the first sign of meaningful weakness, while a rebound could keep the uptrend intact. Traders are watching whether buyers can hold key moving-average support to prevent a deeper correction.
US Dollar Index Price Prediction
The US Dollar Index rose above its 50-day SMA (98.99), but higher levels have attracted selling interest. If the index slips back under the moving averages, it may trade inside a familiar range for a while, whereas a strong rebound from the averages would point to renewed buying on dips. Market participants are monitoring whether sellers can defend the higher zone or bulls will push the index toward the next resistance.
Bitcoin Price Prediction
Bitcoin’s pullback is testing near-term support around $92,000, with the 2026 yearly open (~$87,000) and the $80,500 range lows marked as the most important levels to defend. If buyers step in at these supports, BTC could stabilize and attempt another run toward recent overhead resistance; however, sustained weakness and a close below those levels would suggest a larger consolidation. For a broader compilation of levels and signals, consult the key Bitcoin levels review.
Ethereum Price Prediction
Ether remains contained within a symmetrical triangle pattern, a setup that reflects uncertainty about the next directional move. The short-term moving average sits nearby and the momentum indicators do not favor either side decisively, so the pair could remain range-bound until a clear breakout or breakdown occurs. A close above the triangle’s resistance would benefit the bulls, while a close below the support line would give bears the advantage.
Altcoin Price Predictions
XRP’s break below the 50-day SMA ($2) indicates renewed bearish pressure, with the bears likely to try pushing the price toward the nearby support zone. If buyers defend that zone strongly, XRP could remain inside its channel for some time, but a decisive close below support would increase downside momentum. Traders will need to see a break above the downtrend line to signal a potential change in the intermediate trend.
BNB slipped under its 20-day EMA, yet long lower tails suggest buying interest at reduced levels. Bulls will have to push BNB above the immediate resistance to resume upside momentum, while sellers will try to pull the price below the 50-day SMA to invalidate recent strength. The contest between overhead resistance and support will determine the near-term direction.
Solana turned down from the $147 resistance and has reached the 50-day SMA ($132), showing bears are active at higher prices. With moving averages flattening and momentum muted, SOL could consolidate inside the $117–$147 band until buyers force a breakout or sellers break the lower range. A move above $147 would favor bulls, while a drop below the lower bound would favor further downside.
Dogecoin fell below the moving averages and reached the $0.12 support, where bulls showed a defensive reaction. If buyers can overcome resistance at the averages, DOGE may trade sideways between established support and resistance levels for a while. Conversely, a failure to hold $0.12 would likely open the path to lower testing levels.
Cardano broke below the moving averages and is heading toward the $0.33 support, which buyers are expected to defend. A strong rebound from $0.33 would allow bulls to attempt a push back above the downtrend line, while a break below that support would expose lower channel support. Monitoring the price action at $0.33 will be key to judging ADA’s near-term bias.
Bitcoin Cash closed below its 50-day SMA ($594), suggesting bears are trying to take control. Short-term momentum indicators point to downside risk, and a failure to regain the 20-day EMA would increase the chance of further declines. The first sign of strength would be a clear move back above the short-term moving average.
For context on how these altcoin dynamics fit into broader market moves, see our review of price and altcoins which summarizes key levels across coins.
Why this matters
For a miner operating in Russia with anywhere from a single rig to several hundred, short-term market swings can change fiat-denominated revenue even if hash-rate and block rewards stay constant. A stronger risk-off move may compress coin prices, making immediate sale proceeds lower, while a recovery would improve returns if you hold coins. Also, broader market moves can influence liquidity and ease of converting crypto to rubles, so staying aware of key levels helps with operational planning.
What to do?
- Monitor key BTC levels (near $92,000, the ~ $87,000 yearly open and $80,500 range low) and set clear sell or hold rules based on those supports and your cost structure.
- Watch moving averages and patterns for ETH and major altcoins—a break from the symmetrical triangle on Ether or a breach of the 50-day SMAs on altcoins can change short-term liquidity needs.
- Manage electricity and operational costs first: if prices fall below your breakeven, prioritize uptime adjustments, maintenance, and parts to reduce unexpected downtime.
- Use staged price exits or hedges where available, and avoid emotional all-or-nothing decisions; plan for both prolonged consolidation and sudden rebounds.
- Keep records for tax and regulatory compliance and maintain fiat liquidity to cover fixed expenses during volatile periods.
This piece summarizes market views and chart levels reported on Jan 19, 2026; it is not investment advice and does not replace your own research.