Bitcoin’s relative strength index (RSI) has turned bullish across several timeframes, and some traders interpret that shift as a signal for renewed upside. One prominent trader, BitBull, suggested BTC could reach about $103,000–$105,000 within three to four weeks after a weekly RSI breakout that began holding in December. At the same time, other market participants warn that lower levels are still possible while price searches for a durable support base.
Bitcoin RSI Signals Turn Bullish
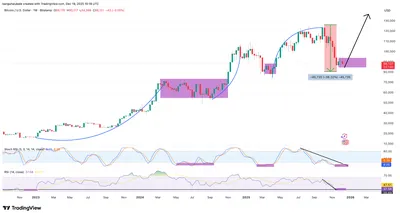
The RSI flip to bullish appears on multiple timeframes, with a weekly breakout that started in December and remains intact. BitBull highlighted this breakout in an X post and compared it with an earlier breakout that preceded months of price gains after April’s local lows. Based on the current RSI setup, BitBull projected BTC could reach roughly $103K–$105K within three to four weeks.
Trader Insights on Bitcoin RSI
BitBull’s X post emphasized the ongoing weekly RSI breakout and its potential implications for price action, while other commentators pointed to the two-week chart for additional context. James Easton noted that the two-week RSI is now at lower levels than during the trough of the 2022 bear market and has flipped bullish, which he highlighted to his audience. For readers who want broader technical context, see BTC forecast 2026 for related analysis on trend setups and signals.
Hidden Bullish Divergence on Lower Timeframes
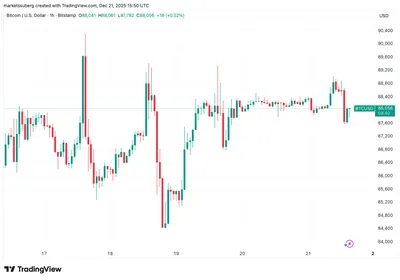
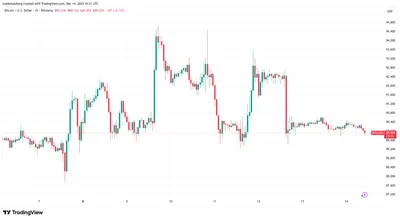
On shorter timeframes, data from TradingView showed a potential hidden bullish divergence on the four-hour chart, where RSI made lower lows while price formed higher lows. That pattern is commonly read as a sign of weakening sell-side pressure as buyers step in earlier on pullbacks. This divergence supports the idea that Bitcoin is attempting to cement the $90,000 area as a support zone while consolidating.
Market Dynamics and Sell Pressure
Despite bullish RSI signals, many traders still expect lower levels to appear while the market searches for a long-term support base, and some bearish scenarios remain in circulation. Analyst Skew flagged a passive seller active at $91,500, which has helped keep price suppressed, and noted that buy pressure during the US session looked tied to a "clear US buyer." These order-book features are part of why participants are watching both momentum indicators and visible sell liquidity.
Why this matters
If you run mining equipment in Russia with anywhere from a single rig to a modest farm, these RSI developments matter mainly as market context rather than direct operational guidance. Bullish RSI readings and a possible move toward $103K–$105K could reduce short-term selling pressure, but they do not guarantee higher prices or change electricity and maintenance realities. At the same time, visible sell orders around $91,500 and continued talk of lower levels mean miners should avoid assuming a smooth rally.
What to do?
- Monitor RSI across timeframes (weekly, two-week, four-hour) to see whether bullish signals hold or reverse.
- Watch support around $90,000 and the passive sell level near $91,500 on order books to gauge immediate sell pressure.
- Manage risk and operating costs: ensure your power and cashflow plans account for possible short-term dips even if indicators look bullish.
- Follow trading-session flows, particularly US-session liquidity, since traders flagged a clear US buyer as affecting recent moves.
FAQ
Q: Does a bullish RSI guarantee a move to $105K?
A: No. The article notes that RSI has flipped bullish and that a trader projected $103K–$105K, but indicators indicate potential paths, not certainties. Traders still warn that lower levels could emerge while the market seeks a stable support range.
Q: What is a hidden bullish divergence and why it matters?
A: A hidden bullish divergence occurs when RSI makes lower lows while price makes higher lows; in this case the four-hour chart showed that pattern, which traders interpret as weakening sell-side pressure and increased chance of support holding during pullbacks.
Q: Should miners act on the passive seller flagged at $91,500?
A: The passive seller is one observable piece of order-book behavior that has suppressed upside recently. Miners can use that information to monitor short-term resistance and liquidity but should combine it with their operational and financial considerations before making decisions.