Why did Bitcoin’s weekly RSI fall to levels last seen in January 2023? The short answer: a 36% drawdown from the all‑time high pushed high‑timeframe momentum indicators into deep oversold territory, with data from Cointelegraph Markets Pro and TradingView showing unusually low weekly RSI readings. At the same time, on‑chain metrics from CryptoQuant signalled a valuation discount, prompting debate among analysts about whether this marks a short‑term bottom or a continuation of the decline.
Key takeaway
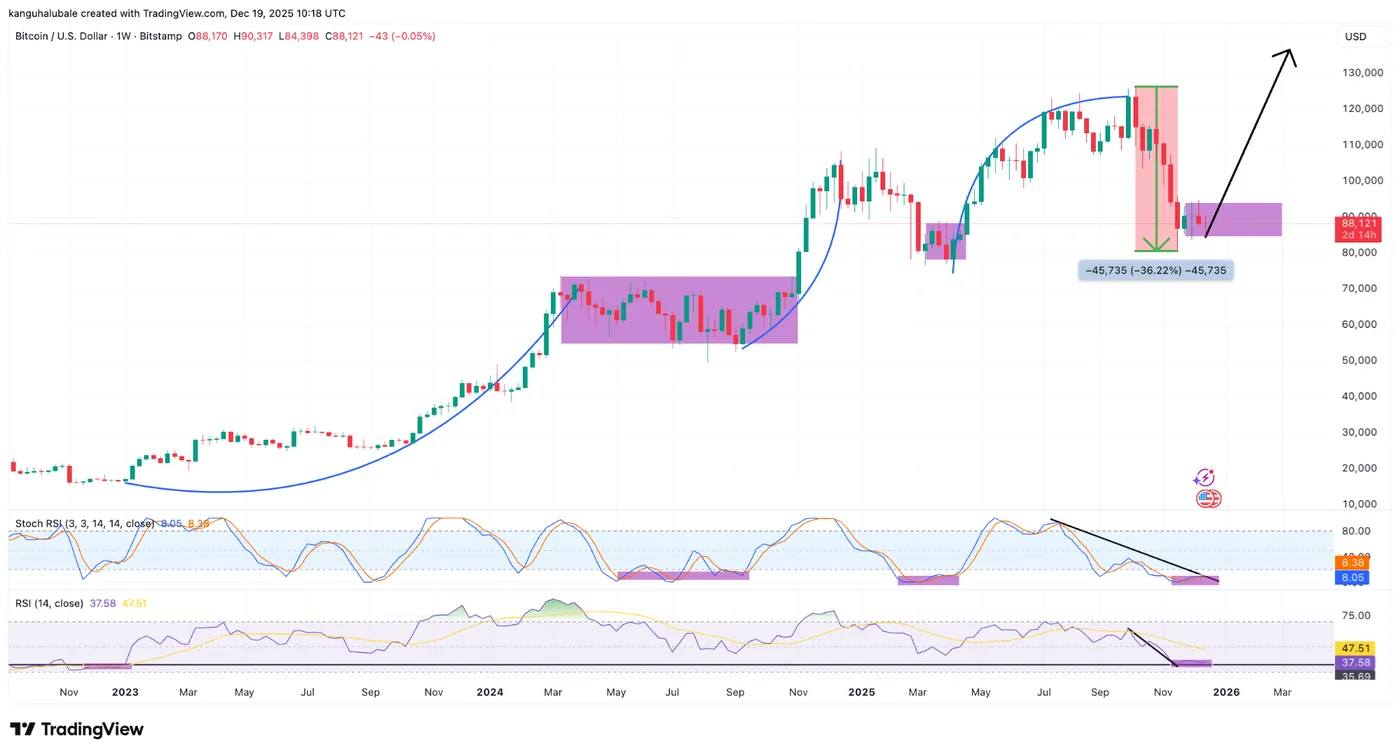
The weekly RSI dropped from local highs of 64 in September to 35 at the time of writing, returning to levels not seen since January 2023 when BTC traded around $15,500–$17,000. Bitcoin experienced a 36% fall to $80,500 on Nov. 21 from an all‑time high of $126,000, which largely explains the RSI move. CryptoQuant’s NVT Golden Cross reached a historically depressed level near -0.6 and has since risen to about -0.32, a shift some analysts read as a sign of structural undervaluation near $87,000. Analysts quoted in the coverage offer differing takes, and this article is informational, not investment advice.
RSI movement and historical context
On the weekly chart the RSI slid from a local peak of 64 in September down to 35, a level last observed in January 2023 when Bitcoin traded roughly between $15,500 and $17,000. RSI uses three key reference points — 30 for oversold, 50 as the midpoint and 70 for overbought — so a weekly reading of 35 places BTC close to oversold territory while not yet below the 30 boundary. Some commentators contrasted the standard RSI with the Stochastic RSI; for example, Mister Crypto said "Bitcoin looks the most oversold it’s been all cycle," referring specifically to the Stochastic RSI shown on the two‑week chart.
Price action details: drawdown and liquidity
The recent momentum shift follows a 36% drop from an all‑time high of $126,000 to a low of $80,500 on Nov. 21, which materially reduced weekly momentum readings. Cointelegraph noted that a heavy concentration of liquidity clusters above the spot price supports a thesis for a possible short‑term BTC/USD reversal, a factor that some traders cite when expecting a relief bounce. At the same time, opposing voices warn that past instances of similarly low weekly RSI readings preceded further losses; for example, Lark Davis noted past post‑oversold dumps of 49% in 2018 and 58% in 2022 and suggested BTC "could go another 40% lower."
On‑chain NVT analysis: is Bitcoin undervalued at $87,000?
CryptoQuant’s NVT Golden Cross compares market value with network usage and recently dropped to a historically depressed level near -0.6, which analyst MorenoDV_ described as "a zone that reflects a structural undervaluation of the network" in his Quicktake analysis. The metric then increased slightly to about -0.32 over the last few days, which CryptoQuant interprets as the price beginning to realign with transaction‑driven fundamentals after a sharp valuation discount. Another analyst, CryptosRus, said the "indicator remains in negative territory, meaning Bitcoin is still priced conservatively relative to its network utility." Note that the last two times the NVT Golden Cross reached such lows were in April 2025 and at the bottom of the 2022 bear market, preceding 60% and 350% BTC rallies respectively.
Market commentary and differing analyst views
Different conclusions stem from the same inputs: some traders treat an extremely low weekly RSI and a depressed NVT as a buy signal, while others point to historical examples where oversold readings preceded further declines. Analyst Jelle wrote on X that "Historically, when the weekly RSI tags this level, it’s time to pay attention," highlighting the need for caution and focus rather than a binary call. Mister Crypto emphasised extreme oversold readings on the Stochastic RSI, while Lark Davis warned of larger post‑oversold drawdowns in prior cycles, illustrating why market participants interpret the same indicators differently.
Почему это важно
Для майнера в России и с 1–1000 устройствами это означает, что текущие индикаторы указывают на высокую волатильность: с одной стороны, возможен короткий отскок из‑за сильно перепроданных показателей, с другой — исторические примеры показывают риск дальнейшего падения. При этом данные NVT указывают на оценочный дисконт относительно использования сети, но это не гарантирует немедленного восстановления цены.
Что делать?
Короткие рекомендации для практического применения — сохраняйте последовательность действий и рамки риска, опираясь на проверяемые данные. Ниже — набор конкретных шагов, которые помогут управлять риском и информацией:
- Проверяйте исходные данные на Cointelegraph Markets Pro и TradingView, чтобы отслеживать weekly RSI и Stochastic RSI в реальном времени.
- Смотрите метрики NVT на CryptoQuant, включая динамику NVT Golden Cross (например, -0.6 → -0.32), чтобы понимать, есть ли скидка к сети.
- Устанавливайте лимиты риска и планы на случай как резкого отскока, так и дальнейшего снижения, опираясь на ваши реальные финансовые возможности.
Sources and data
Primary data and commentary referenced in this article come from Cointelegraph Markets Pro and TradingView for RSI readings, and CryptoQuant for the NVT Golden Cross figures. Specific data points cited include the 36% drawdown that took BTC from $126,000 to $80,500 on Nov. 21, the weekly RSI move from 64 to 35, January 2023 RSI comparisons when BTC traded around $15,500–$17,000, and the NVT Golden Cross troughs near -0.6 and the recent rise to -0.32. For related coverage on price action and NVT recovery see price fell below $88,000 and analysis of the NVT Golden Cross recovery.
This article does not contain investment advice or recommendations. Every investment and trading move involves risk, and readers should conduct their own research when making a decision.