Bitcoin remains stuck between bulls and bears as traders grow frustrated by the lack of a decisive breakout. Price targets have split widely: some market participants warn of a return to yearly lows, while others expect a renewed bull run, leaving the short-term outlook highly contested. At the same time, macro moves in Japan and record highs in precious metals are reshaping where investors seek safety.
Bitcoin Price Analysis: Bull vs Bear Market
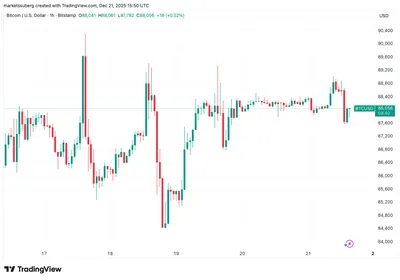
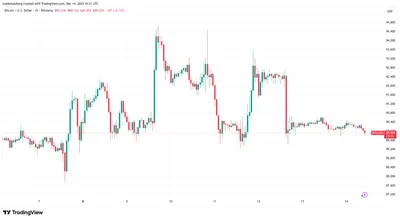
Bulls briefly pushed Bitcoin toward multiday highs as they tried to revisit the $90,000 area, but overall momentum has failed to produce a clear breakout. Traders are polarized: CrypNuevo noted both downside and upside scenarios are possible, citing reduced sell-side capital and a potential revisit of the 50-day EMA, while others such as Killa warn of a deeper drawdown. For more on scenarios and risk management, see a price forecast that outlines expectations and key levels.
Impact of Japan's Economy on Bitcoin
Markets are watching Japan closely after its ten-year bond yield hit a record 2.1%, amid a central bank move to higher interest rates and officials planning a large stimulus package. That combination has historically created jittery conditions for risk assets, and analysts point to Japan’s instability as one factor that can sap appetite for crypto. Traders are treating precious metals and other safe havens differently than digital assets as a result.
Gold and Silver Hit Record Highs
Precious metals extended gains this week, with gold reaching $4,420 per ounce and silver approaching the $70 mark, a sharp rise for the year. That strength in metals has coincided with a relative underperformance for Bitcoin and many altcoins, reinforcing a narrative of a partial flight to safety among some investors. For a closer comparison of BTC and metals indicators, read our piece on Bitcoin vs gold.
Market Sentiment and Indicators
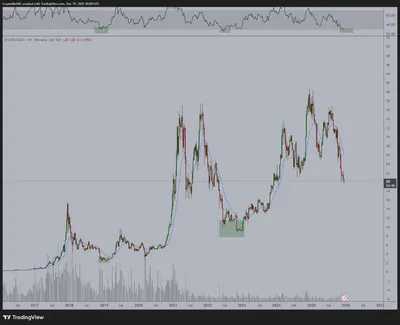
Onchain and market indicators paint a cautious picture: CryptoQuant’s Bull‑Bear Market Cycle Indicator sits at -0.52, its weakest reading since the 2022 bear market, which signals defensive conditions across the market. The Coinbase Premium briefly hit -$56 on Dec. 18, reflecting persistent US selling pressure before a partial rebound, and the Crypto Fear & Greed Index sits at 25/100, categorized as “extreme fear.” Together, these measures underline how thin bullish conviction is right now.
Expert Opinions and Predictions
Views among analysts are mixed. Some, like Michaël van de Poppe, point out that extreme fear can precede strong moves higher, while Santiment reminds traders that markets often move opposite to prevailing retail sentiment. Other commentators, including GugaOnChain and Daan Crypto Trades, emphasize reduced activity and a lack of clear directional outliers, which makes short-term timing difficult. For context on why Bitcoin struggled near $90,000 earlier in the month, see why BTC fell.
Why this matters
If you run mining equipment, these developments affect the environment in which you sell or hold BTC. Wide divergence in price targets and low sentiment generally mean higher short‑term volatility, which can alter returns when you convert mined coins to cash. At the same time, stronger demand for gold and persistent selling pressure on US exchanges can change liquidity conditions and the timing of buyers and sellers.
What to do?
Focus on operational resilience and clear rules for handling mined coins to reduce stress during churny markets. Avoid ad‑hoc decisions driven by headlines; instead, use predefined thresholds for selling and keep an eye on market indicators that reflect demand and risk appetite.
- Set simple rules: decide in advance what portion of daily or weekly block rewards you convert to fiat and what portion you hold.
- Monitor key indicators: Coinbase Premium, the Bull‑Bear Indicator, and the Fear & Greed Index can help you read demand and sentiment shifts.
- Protect margins: audit power costs and consider temporarily reducing nonessential rigs during prolonged price pressure.
- Keep liquidity accessible: avoid locking all BTC into illiquid positions when sentiment is extreme.
This article is for informational purposes and not financial advice. Every decision about mining operations or trading involves risk; maintain clear rules and do your own research before acting.