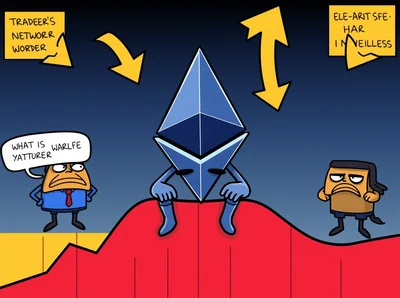
Ethereum is trading just above the $3,000 mark and has been moving sideways rather than trending decisively. As of Dec. 22, 2025, ETH is priced at $3,049, and intraday action has been confined to a tight range that reflects market indecision more than momentum. Traders are watching key technical levels closely while short‑term moving averages show only modest upward potential.
Current Ethereum Price and Market Overview
ETH commands a market cap of $368 billion and a 24‑hour trading volume of $17.78 billion, illustrating continued liquidity in the market. The intraday trading band has been narrow, with price oscillating between $2,969 and $3,065, which points to consolidation rather than a clear directional move. This compact range means breakouts require confirmation before market participants can assume a new trend is forming.
Technical Analysis and Chart Patterns
On the daily chart, the broader structure looks like a strategic standoff between buyers and sellers after a rejection near $3,450. The market appears to be consolidating inside a larger range bounded by roughly $2,620 on the downside and $3,450 on the upside, and volume rose during the recent pullback, suggesting active distribution rather than exhausted buying. The price still shows a series of higher lows, which keeps a cautiously constructive outlook intact.
Resistance remains clustered between $3,300 and $3,450, while initial support sits at $2,900 and a more critical band lies between $2,750 and $2,620. On shorter timeframes, the 4‑hour chart shows higher lows and a recovery above $3,000, but momentum is slowing near the $3,075–$3,100 area, which acts as a short‑term supply zone. A sustained break below $2,980 would force a structural reassessment of the current consolidation.
For readers tracking recent developments, the market context and prior pullbacks are covered in more detail in this piece on the Ethereum price drop, which discusses drivers behind earlier declines and implications for ranges like the current one.
Indicator Analysis
- RSI: 49.6 — near neutral territory, neither overbought nor oversold.
- Stochastic oscillator: 34.9 — below midline, showing limited upside momentum.
- CCI: –23.2 — mildly negative, consistent with sideways action.
The average directional index (ADX) sits at 28.9, which confirms the lack of a dominant trend and aligns with the range‑bound price behavior. Momentum indicators read as follows: Awesome oscillator –50.6, momentum indicator –34.2, and MACD –47.2, collectively painting a mixed picture with slight negative tilt despite short‑term constructive signals. Short‑term moving averages show modest strength, with the 10‑period EMA at $3,000.6 and the 10‑period SMA at $2,976.8, while higher‑period MAs remain above the current price and act as resistance.
Bullish and Bearish Outlook
Bull case: Resilience above $3,000 together with higher lows across timeframes suggests bulls remain in the game and could attempt a measured advance if momentum improves. A decisive push through $3,100 with confirming volume is presented in the market view as the most reliable signal that the consolidation may resolve to the upside.
Bear case: The flattening momentum indicators and the cluster of overhead resistance between $3,300 and $3,450 imply the rally could lose steam, making fade‑the‑rip tactics more attractive until price convincingly clears the short‑term supply zone. Until a breakout occurs, range management and risk controls are the prudent approach.
Почему это важно
Если вы майните Ethereum, текущая консолидация означает, что рыночная цена пока не даёт сильных сигналов к агрессивным продажам или покупкам. Положение выше $3,000 сохраняет относительную ценовую устойчивость, но индикаторы показывают нейтральную картину, поэтому доходы от майнинга могут оставаться волатильными в узком диапазоне. Мониторинг ключевых уровней поддержки и сопротивления поможет быстро оценивать, когда стоит менять операционные или торговые решения.
Что делать?
Практические шаги для майнера с 1–1000 устройствами: отслеживайте уровни поддержки $2,900 и зону $2,750–$2,620, а также сопротивление $3,300–$3,450, чтобы планировать продажи или корректировать стоп‑ордера. Поддерживайте техническое обслуживание и учёт расходов на электроэнергию, сохраняйте дисциплину в управлении рисками и избегайте импульсивных решений на фоне краткосрочной волатильности. Для дополнительного контекста по связанным депозитным движениям и их влиянию на рынок можно почитать материал о Kraken deposit.
FAQ
What is the current price of ethereum? Ethereum is trading at $3,049 as of December 22, 2025. Is ethereum showing bullish or bearish signals? ETH is consolidating above $3,000 with mixed short‑term technical readings that do not point to a clear trend. What are key support and resistance levels for ethereum? Support is near $2,900 with a lower band at $2,750–$2,620; resistance sits between $3,300 and $3,450.