Bitcoin is trading at $87,382 as of Dec. 27, 2025, holding a market cap of $1.74 trillion and logging $30.6 billion in 24-hour volume. The market moved inside a narrow intraday range between $86,673 and $88,965, suggesting consolidation ahead of a directional move. Indicators across timeframes point to indecision rather than conviction, so watching price with volume is the clearest way to read the next chapter.
Current Bitcoin Market Overview
The price sits in a tight band after topping near $94,652 and sliding down into the current $87,000–$88,000 area. Market-wide measures show reduced trading activity, with 24-hour volume at $30.6 billion, which makes breakouts less reliable without accompanying volume. For more detail on the day’s levels and context, see December 2025 levels.
Technical Analysis on Different Timeframes
Daily
On the daily chart, bitcoin is forming lower highs and lower lows, a descending structure that signals bearish bias without an aggressive collapse. The move down from the recent high near $94,652 left price humming in the $87K–$88K zone, while moving averages remain above the market and point to broader weakness.
4-hour
The 4-hour picture shows bearish pressure with a rejection from higher levels and a support level at $86,363 that has thus far held. Upswings are met with lighter volume than sell-offs, which keeps sellers with the louder voice in the current range.
1-hour
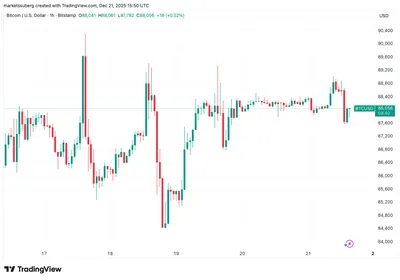
The 1-hour chart tightened into a narrow band between $87,000 and $87,500 after a flash drop from roughly $89,400 to $86,500 that spooked intraday traders. This kind of low-volume consolidation can act either as an accumulation zone for a breakout or as a bear flag that precedes another leg down if key support gives way.
Key Technical Indicators
- RSI, Stochastic, CCI, ADX and the Awesome Oscillator are all neutral, reflecting market indecision.
- Momentum and MACD show slight upward signals, offering a small edge to buyers if volume confirms.
- Moving averages from EMA 10 through SMA 200 sit above price and lean bearish, signaling that the trend remains under pressure.
Bullish and Bearish Scenarios
Bull case: a decisive break above $88,500 accompanied by meaningful volume would favor a short-term revisit toward the $90,000–$91,000 resistance zone. Momentum and MACD are the only indicators giving a modest nod to buyers, so conviction would need volume behind it.
Bear case: if price fails to hold the $86,000 support, the 1-hour bear flag may confirm and open potential downside targets around $83,500–$84,000. The ensemble of moving averages above price and volume patterns that favor sell-offs keep the path of least resistance to the downside.
Market Sentiment and Volume Analysis
Overall volume is subdued, which points to market indecision rather than a clear trend continuation. When rallies occur on lower volume and sell-offs on higher volume, the technical backdrop tilts toward bearish pressure despite sideways price action.
Why this matters
For a miner operating from a single device up to a small farm in Russia, these price dynamics affect revenue realization and short-term decisions. The current $87,382 price and the nearby support/resistance levels give concrete reference points for when to convert mined coins or hold them longer.
Because volume is low and flash drops are possible, miners may face brief windows where selling during a spike or a dip changes proceeds noticeably. Knowing that $86,363 and $86,000 are the relevant support areas, while $88,500 is the immediate resistance, helps set simple rules for action.
What to do?
- Set clear thresholds for selling: consider plans tied to the preserved support and resistance levels (for example, monitor reactions at $86,000 and $88,500) rather than reacting to every intraday move.
- Avoid panic selling on brief flash drops like the recent fall from about $89,400 to $86,500; check whether volume confirms a sustained move before executing major sales.
- Use small, regular conversions to manage operational costs if you have ongoing electricity and maintenance expenses, aligning transactions with your cash-flow needs and the current price band.
- Keep an eye on volume: a breakout with strong volume is more actionable than a quiet price breach. For further reading on the recent consolidation, see consolidation near $88K.
FAQ
What is bitcoin’s price today?
Bitcoin is trading at $87,382 as of Dec. 27, 2025.
Is bitcoin going up or down right now?
BTC is consolidating in a tight range with mixed technical signals: some indicators are neutral while momentum and MACD show slight upward bias.
What are the key levels to watch?
Watch $88,500 for a potential upside break and $86,000 as the pivotal downside support; support at $86,363 has so far held and failure could target $83,500–$84,000.
Why is volume low today?
Trading volume is reduced—24-hour volume is $30.6 billion—contributing to market indecision and making breakouts less reliable without confirming volume.