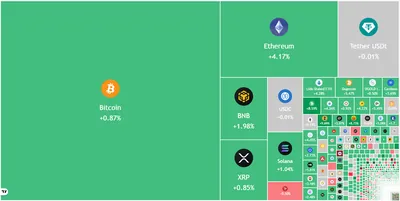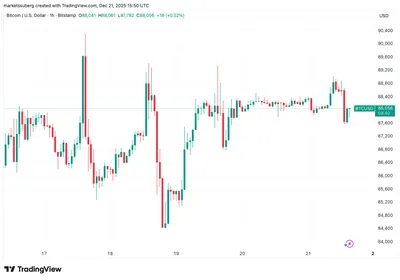
Bitcoin and several major altcoins tried to start a relief rally on December 26, but higher levels continued to attract selling pressure. Bitcoin rose above $89,500 yet the bulls could not sustain that strength, while many altcoins remain near recent lows and show mixed technicals.
Bitcoin (BTC) Price Prediction
Bitcoin briefly climbed past $89,500 but turned down from the 20-day exponential moving average at $88,593, which points to negative short-term sentiment. The most important support to monitor on the downside is $84,000; a violation of that level could allow the downtrend to resume. Institutional flows are relevant to the outlook: BTC exchange-traded funds have recorded outflows of more than $1 billion since Dec. 15, according to Farside Investors, even as some industry figures stress stronger fundamentals.
On the policy side, BTSE chief operating officer Jeff Mei suggested that a single 0.25% Fed rate cut combined with steady Treasury purchases could push BTC toward the $92,000–$98,000 range. Strategy CEO Phong Le has also said BTC’s fundamentals "couldn’t be better," underscoring divergent signals between technicals and some longer-term views. For more on levels and technical signals see Bitcoin key levels for additional chart context.
Ethereum (ETH) Price Analysis
Ether continues to trade inside a symmetrical triangle pattern, which reflects a balance between supply and demand. While that pattern persists, price action can remain range-bound until a clear breakout or breakdown occurs. Traders should watch for a decisive resolution of the triangle before assuming a directional bias.
BNB (BNB) Price Forecast
BNB has reached its uptrend line, a near-term technical level to watch. A successful push above the short-term moving averages would signal strength for buyers, while a close below the uptrend line would indicate that bears have regained control. Momentum around that line will influence the next directional move for BNB.
XRP (XRP) Price Outlook
XRP remains inside a descending channel pattern, though bulls are attempting to start a recovery. Buyers will need to show strength at the moving averages to shift the short-term bias, while failure to do so could keep the pair under pressure. The channel structure suggests continued caution until a breakout appears.
Solana (SOL) Price Prediction
Buyers are attempting a recovery in Solana, but the price candles show long wicks, which indicate selling pressure at higher levels. That pattern suggests attempts to rally are meeting resistance and a clear break above the short-term moving average would be needed to confirm strength. Until then, upward moves may be limited by sellers taking profits.
Dogecoin (DOGE) Price Analysis
Dogecoin remains below the $0.13 level, signalling that bears continue to exert pressure on the token. The sustained position under that threshold keeps the short-term outlook bearish, although indicators noted in market commentary suggest some weakening of bearish momentum. A confirmed move back above the moving averages would be required to shift the bias toward bulls.
Cardano (ADA) Price Forecast
Buyers are trying to push Cardano back above the breakdown level of $0.37, and positive divergences on momentum indicators have been observed in that context. A close above the 20-day EMA would signal the start of a recovery, while a failure to clear that level would indicate that sellers remain dominant. The near-term direction depends on whether buyers can sustain gains above the breakdown level.
Bitcoin Cash (BCH) Price Outlook
Bitcoin Cash turned up from the 20-day EMA at $575, which indicates short-term positive sentiment for the pair. Bulls will look to build on that bounce and try to take control above nearby resistance, while a reversal below the moving averages would point to consolidation. The recent rebound suggests at least temporary strength for BCH.
Chainlink (LINK) Price Prediction
Chainlink remains sandwiched between the 20-day EMA at $12.78 and the $11.61 support, trading in a tight range for now. Such compression often precedes a stronger move, so traders watch for a breakout above the moving averages or a breakdown below support to define the next leg. Until that range resolves, directional signals remain limited.
Hyperliquid (HYPE) Price Analysis
Hyperliquid is trading below the 20-day EMA ($26.72) but has held above the $22.19 support, indicating the bears have not yet overwhelmed the bulls. This position leaves the market in a wait-and-see state until buyers can push above the short-term moving average. Failure to do so could increase downside risk, while a break above would suggest renewed bullish attempts.
Why this matters
For miners in Russia running from a single rig up to a large farm, these technicals explain short-term price behavior rather than immediate operational changes. Falling below key supports can reduce expected revenues in fiat terms, while failed rebounds mean less chance to realize gains on mined coins. Institutional flows and macro-related commentary cited above are part of market sentiment but do not directly change mining hardware performance or electricity consumption.
Keep an eye on price levels mentioned here because they affect when miners might convert coins to cover costs or when they might hold for a recovery. If you follow BTC closely, the combination of ETF outflows and the short-term EMA rejection is useful context when planning payouts or budgeting for upcoming bills; for broader strategy, see analysis on why Bitcoin is falling.
What to do?
Review your immediate cash needs and set simple conversion rules tied to the support and resistance levels noted above. If you need fiat to cover electricity or maintenance, consider converting smaller, planned amounts rather than reacting to every intraday swing.
Also, keep routine operational checks up to date: monitor machine uptime, validate profitability per rig at current prices, and avoid making hardware or power commitments based solely on short-term price spikes. Clear conversion rules and conservative budgeting help manage risk when markets are indecisive.
This article summarizes chart-based price reads and does not constitute investment advice.