Bitcoin is consolidating within a narrow range, showing no clear direction, with a price of $88,195 as of December 20, 2025. Market capitalization stands at $1.76 trillion, and 24-hour trading volume is $37.07 billion, reflecting market activity without a strong momentum. The intraday range is limited, indicating participants are awaiting a catalyst.
Current Bitcoin Price and Market Metrics
A brief overview of key figures that set the market context. These parameters help gauge the scale of current player positions and important levels for risk assessment.
- Price: $88,195 (as of December 20, 2025).
- Market capitalization: $1.76 trillion.
- 24-hour trading volume: $37.07 billion.
Bitcoin Chart Analysis
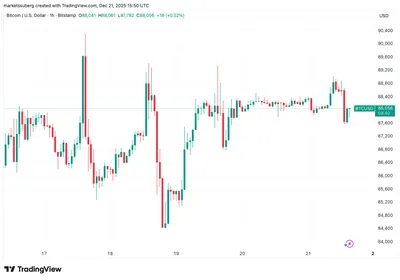
The hourly chart shows a phase of low-volatility consolidation: price fluctuates roughly between $86,929 and $88,759 without a confident direction. During this session, there was a brief attempt to rise to $89,349, but it quickly retraced, indicating weak breakout momentum and lack of volume support from participants.
Looking at the 4-hour timeframe, the structure appears healthier: after a sharp downward move, a support level was found near $84,398, followed by a strong rebound with a volume spike and subsequent recovery. On the daily chart, a base formed around $87,500–$88,500 after a decline from about $96,736, adding realism to the recovery picture. For detailed scenarios and key levels, see the Bitcoin price forecast and related materials.
Technical Indicators
The state of oscillators and moving averages presents a mixed picture: most indicators are in neutral zones, supporting the idea of consolidation without trend confidence. This is also reflected in volumes, which decreased during the breakout attempt.
- RSI — 44; Stochastic — 28; CCI — −53; ADX — 26: all in neutral territory, confirming absence of a dominant trend.
- Awesome Oscillator remains negative, but momentum (10) and MACD histogram show signs of internal improvement, although price behavior remains cautious.
- Price trades below EMA and SMA for periods 10, 20, 30, 50, 100, and 200—from short-term EMAs up to the 200-period SMA—creating multiple resistance levels above.
Bullish and Bearish Scenarios
The bullish scenario is based on the rebound from $84,398 and improvements in momentum (10) and MACD histogram, indicating reduced selling pressure and position accumulation. If consolidation resolves upward with volume confirming the move, the structure may begin a more noticeable recovery and test resistance zones higher up.
The bearish scenario focuses on the fact that price remains below all key EMAs and SMAs, and neutral indicator readings imply uncertainty. In this case, consolidation could resolve with a continuation of the downward trend, making it important to watch whether price can confidently overcome the stacked resistance levels above.
Why This Matters
For miners, the consolidation situation means relative price stability in the short term but no sustained rise that could improve mining profitability. Understanding that the market is currently awaiting a catalyst helps set short-term revenue expectations and plan operational expenses without assuming rapid growth.
If consolidation breaks upward, mining profitability could improve, but without a clear breakout confirmation, relying on this is risky; conversely, the likelihood of testing lower levels remains, which should be considered when assessing risks and building financial cushions.
What to Do?
Practical steps for miners with 1–1000 devices—a short list of actions to reduce risk and maintain flexibility amid uncertainty. These recommendations do not predict outcomes but are based on the current market state and technical picture.
- Review mining cost and adjust operational expenses as needed to withstand consolidation periods.
- Keep part of revenue in reserve to cover unforeseen expenses and potential profitability drops if lower levels are tested.
- Avoid rushing to scale up during a boom without volume-confirmed breakout; monitor confirming signals on daily and 4-hour timeframes.
- Use available analytical materials to assess risks; for example, consult the overall Bitcoin price forecast before major operations.
Frequently Asked Questions
What is the current Bitcoin price on December 20, 2025? Bitcoin trades at $88,195 and remains within a narrow intraday range, indicating consolidation rather than a strong trend.
Why is Bitcoin consolidating around $88,000? Consolidation is explained by neutral indicator readings and declining volumes, signaling anticipation of a catalyst and lack of significant momentum from participants.
What do the technical indicators show now? RSI 44, Stochastic 28, CCI −53, and ADX 26 are in neutral zones; Awesome Oscillator remains negative; momentum (10) and MACD show internal improvement amid cautious price behavior.
What key levels are traders watching? Intraday range is approximately $86,929–$88,759; brief resistance was recorded at $89,349; a more significant resistance zone is near $90,317. Support is noted at the rebound around $84,398 and the daily base of $87,500–$88,500.