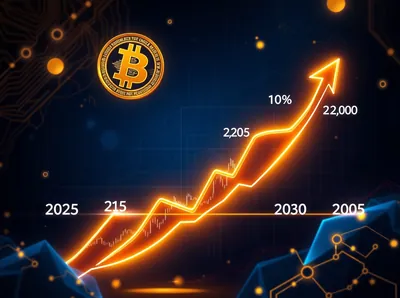
This article summarizes The Graph (GRT) price prediction 2026–2030 and presents the scenarios and ranges discussed in the source analysis. It highlights conservative and optimistic price bands — from $0.85–$1.25 for 2026 up to a 2030 span of $3.00–$15.00 with a most likely $6.00–$9.00 outcome — and reviews tokenomics, partners and key risks without offering trading advice.
What is The Graph (GRT) and how it works
The Graph is a decentralized protocol for indexing and querying data from blockchains, starting with Ethereum, which helps developers access on-chain data efficiently. The project is commonly described as "the Google of blockchain data" because it organizes information so decentralized applications can retrieve the data they need without building custom indexing tools. The native GRT token powers the ecosystem and supports several on-chain roles that create demand beyond pure speculation.
- Indexing rewards
- Curating signal
- Delegating to indexers
- Paying for queries
Current market position and adoption metrics
The Graph has seen growing adoption, with thousands of subgraphs deployed and major DeFi protocols relying on its infrastructure, which underpins a material portion of its use-case narrative. Several leading projects integrate The Graph directly for data indexing and query services, which supports ongoing utility demand for GRT. Partnerships with layer-2 and sidechain networks also expand the protocol's reach and potential query volume.
- Uniswap
- Aave
- Compound
- Synthetix
- Polygon
- Arbitrum
GRT price prediction 2026: early bull market scenarios
The 2026 outlook in the source analysis presents two main bands based on adoption and market conditions. Conservative estimates place GRT price between $0.85 and $1.25 in 2026 if adoption continues at current trajectories and markets are orderly, while more optimistic scenarios that assume accelerated Web3 uptake see prices reaching $1.50–$2.00. These ranges reflect how on-chain demand for indexing, staking and payments could lift token utility under different pace-of-adoption assumptions.
GRT price prediction 2027: maturation and expansion
For 2027 the analysis expects further maturation of the protocol and wider integration across dApps, which would support higher utility demand for GRT. The projected normal market range is $1.20–$2.50, while a breakthrough adoption scenario could push the upper boundary toward $3.50. Observing indexer growth and meaningful increases in query volume would be the kinds of developments that underpin movement into the higher band.
GRT outlook 2028–2029: network effects accelerate
Approaching the end of the decade, network effects are expected to become more visible if developer adoption and subgraph deployment scale. Conservative estimates for 2029 place GRT between $2.00 and $4.00, whereas optimistic projections that assume faster exponential Web3 growth target $5.00–$7.00. The gap between conservative and optimistic scenarios widens with time because long-term price depends heavily on cumulative adoption and protocol revenue trends.
GRT price prediction 2030: long-term scenarios
The 2030 forecast spans a wide range, reflecting uncertainty about whether The Graph becomes a foundational Web3 layer or faces disruption from alternative approaches. The source gives a 2030 range from $3.00 to $15.00, with the most likely scenario centered around $6.00–$9.00 if current adoption trends continue. These long-term bands should be read as scenario ranges rather than precise targets, since many on-chain and market variables influence outcomes.
Risks, challenges and what could derail growth
Several categories of risk could limit GRT’s upside even if fundamental utility exists, and these factors deserve attention when evaluating scenarios. Protocol-level risks include technical competition or slower-than-expected developer adoption, while market-level risks cover broader crypto cycles and liquidity dynamics that affect token value regardless of protocol performance. Tokenomics also matters: although the total supply is fixed at 10 billion tokens with controlled inflation, issuance and staking behavior can influence circulating supply and incentives.
- Competition or technical disruption to indexing approaches
- Slower developer or dApp adoption reducing query demand
- Broader crypto market cycles and liquidity constraints
- Tokenomics and inflation dynamics despite controlled supply
Alternative views and key indicators to watch
Different analysts use varied methodologies, but common indicators help translate adoption into price pressure and vice versa. Technical analysts point to key resistance levels that matter for market sentiment, while fundamental watchers focus on protocol revenue and developer metrics that reflect real usage. Tracking a short list of on-chain and business metrics provides clearer signals about whether the protocol is moving toward conservative or optimistic scenarios.
- Protocol revenue growth and query volume
- Number of subgraphs deployed and developer adoption
- Indexer growth and staking/delegation activity
Why this matters
If you run mining rigs in Russia or elsewhere, The Graph’s price movements may affect you only indirectly unless you hold GRT or operate Graph infrastructure. GRT’s utility for payments, staking and indexing means that stronger adoption can increase token demand, which could influence the market value of any GRT holdings you keep in a portfolio. Even if you do not interact with The Graph directly, shifts in infrastructure demand can signal broader Web3 activity that affects related tokens and services you might mine or support.
What to do?
This is not trading advice; the source explicitly disclaims liability and recommends independent research. Practically, miners with limited devices should focus on operational resilience and risk management, while owners of larger setups can monitor protocol indicators if they consider non-mining exposure to GRT. If you run or plan to run indexer services, track query volumes, subgraph adoption and staking metrics; otherwise, keep holdings modest, diversify, and base any allocation on clearer adoption signals rather than short-term price moves.
FAQ
What is The Graph’s main use case? The Graph indexes blockchain data and makes it easily queryable for decentralized applications, solving a core infrastructure problem for dApp developers. This indexing layer reduces the need for custom data pipelines and speeds up developer workflows.
Who founded The Graph? The Graph was founded by Yaniv Tal, Brandon Ramirez, and Jannis Pohlmann. These founders launched the project to address data-access challenges in Web3 development.
What is GRT total supply? The total supply of GRT is 10 billion tokens with controlled inflation, and the token is used for payments, staking and governance as well as indexing rewards, curating signal, delegating and paying for queries.
Conclusion and investor takeaways
The source analysis outlines scenario ranges from conservative short-term estimates to wide long-term bands, with 2026 conservative ranges at $0.85–$1.25 and a 2030 span of $3.00–$15.00 (most likely $6.00–$9.00 under sustained adoption). The key takeaway is that The Graph’s utility and integrations support real demand mechanics for GRT, but outcomes depend on adoption, protocol revenue and broader market conditions. Disclaimer: The information provided is not trading advice, Bitcoinworld.co.in holds no liability for any investments made based on the information provided on this page; perform independent research before making any decisions.