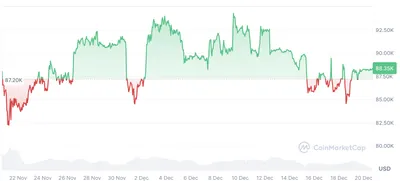
The Crypto Fear & Greed Index currently reads 24, which places it in the 'extreme fear' category. This value, reported by data provider Alternative, is a one-point increase from the previous day but keeps the gauge deep inside the fear band. The index aggregates market volatility, social signals and other metrics to offer a compact snapshot of investor psychology.
Understanding the Crypto Fear & Greed Index at 24
A score of 24 signals extreme market anxiety, a state that the index classifies within the lower band of sentiment readings. The tool is designed to distill multiple data streams into a single daily figure so readers can quickly gauge whether fear or greed is prevailing.
The index operates on a 0–100 scale, where 0 means maximum fear and 100 means maximum greed. The present reading therefore reflects more than price direction: it indicates elevated volatility, weaker social sentiment and lower mainstream search interest relative to calmer periods.
Components of the Crypto Fear & Greed Index
The index is computed from six core components, each contributing a fixed share to the final score. Together these inputs aim to balance price-based signals with behavioral and attention metrics.
- Volatility — 25%
- Market volume and momentum — 25%
- Social media sentiment — 15%
- Surveys — 15%
- Bitcoin dominance — 10%
- Google Trends for "Bitcoin" — 10%
Historical Context of the Index
Putting the current 24 reading into history shows that the index can swing widely: it peaked near 95 during the late‑2021 bull market euphoria and fell into single digits during major crises. Notably, the index dropped to single digits in the March 2020 COVID‑19 crash and again after the Terra‑Luna collapse in May 2022.
While today’s reading marks clear market stress, similar low readings have occurred in previous corrective phases. For more on how the index is interpreted, see the summary of the индекс страха и жадности and a recent comparison with a nearby reading of показатель 20 сегодня.
Expert Insights on Extreme Fear
Behavioral experts point out that extended periods of extreme fear can create opportunities for accumulation, but they also warn against using the index in isolation. Dr. Elara Vance highlights that sustained extreme fear frequently creates conditions conducive to value accumulation, while also urging a distinction between systemic and cyclical sources of fear.
Practitioners therefore combine sentiment indicators with on‑chain analytics and other market data to separate structural problems from transitory panic. That combined view helps reduce false signals that sentiment measures alone can produce.
The Mechanics and Impact of Market Sentiment
The index’s inputs—price volatility, volume, social chatter, surveys, Bitcoin dominance and search trends—feed a feedback loop that can amplify market moves. Low sentiment tends to suppress liquidity and can prolong downswings as retail participants delay entry and some traders reduce exposure.
These sentiment dynamics have tangible effects across the ecosystem: developer engagement and project funding may slow during fear phases, while derivatives markets and funding rates can shift as risk appetite changes. Institutional actors with longer horizons may react differently to the same signals than short‑term speculators.
Почему это важно
Если вы майните в России с любым парком устройств, индекс 24 означает усиление волатильности и возможное снижение ликвидности на спотовых рынках. Из‑за слабого настроения цена и объем торгов могут колебаться сильнее, что влияет на выручку от майнинга и возможности быстрой продажи добытых монет.
При этом сам по себе индекс не меняет работу оборудования, но он отражает риск‑настроение, которое влияет на доступность финансирования и интерес инвесторов. Понимание этого сигнала помогает планировать операционные расходы и денежный поток.
Что делать?
Для майнера в РФ полезно следовать нескольким простым практикам, чтобы уменьшить риски в период «экстремального страха».
- Контролируйте денежный поток: оцените запас средств на оплату электроэнергии и обслуживание, при необходимости сократите ненужные расходы.
- Не полагайтесь только на индекс: проверяйте on‑chain показатели и состояние ликвидности перед крупными решениями по продажам или покупкам.
- Оптимизируйте загрузку оборудования: при падении доходности рассмотрите режимы работы, которые снижают расходы без риска для техники.
- Планируйте продолжительность перерыва: если вы временно снижаете мощность, имейте план по возвращению к полной работе при улучшении рынка.
Итог: индекс на 24 — ясно отрицательный сигнал по настроениям, но он лишь один из инструментов анализа. Следите за динамикой индекса и сочетайте её с техническими и фундаментальными показателями, чтобы принимать взвешенные решения.