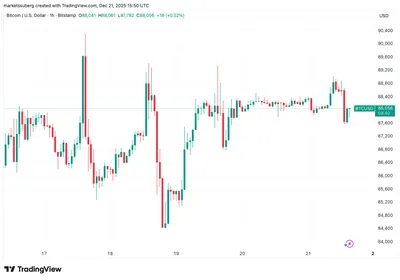
Bitcoin price opened on Wall Street facing a liquidity battle as traders reacted to mixed US employment data. The price struggled to break resistance above $87,000 after falling to nearly $85,000 the previous day, with order-book liquidity clusters influencing its movement. Market participants closely watched these levels amid hopes for a bullish impulse that could push Bitcoin toward the $95,000 mark.
Current Bitcoin Price and Liquidity Situation
At the Wall Street open, Bitcoin buyers and sellers contested control near the $87,000 resistance level. Data from Cointelegraph Markets Pro and TradingView showed bulls grappling with this barrier after the price dipped close to $85,000. Material Indicators highlighted the importance of the 100-week simple moving average, currently at $84,646, as a key support level. These liquidity concentrations acted as guardrails ahead of significant economic data releases.
US Economic Data Impact on Bitcoin Trading
The US labor market presented conflicting signals that influenced risk assets including Bitcoin. The unemployment rate rose to 4.6%, the highest since the third quarter of 2021, suggesting weakening conditions. However, November job additions surpassed expectations by around 14,000, indicating some resilience. This mixed data contributed to uncertainty in Bitcoin’s price action as traders weighed the implications.
Trader Perspectives on Bitcoin Price Movements
Traders offered insights into recent Bitcoin price dynamics. Material Indicators pointed to the 100-week simple moving average as crucial support near $84,646. Trader Kay attributed the price decline from $126,000 to $100,000 to selling by original holders, while the drop from $100,000 to $85,000 was linked to ETF selling. Meanwhile, commentator Exitpump observed significant bid liquidity near $80,000 and suggested a potential clear run to $95,000 if resistance is overcome.
Potential Price Targets and Market Outlook
Looking ahead, a bullish impulse could propel Bitcoin toward the $95,000 target. The presence of large bid liquidity near $80,000 may provide a foundation for price support. However, liquidity is thin between $88,000 and $95,000, which could lead to rapid price movements if a breakout occurs. Traders remain attentive to these levels as they navigate the evolving market conditions.
Why This Matters
For miners operating in Russia with up to 1,000 devices, understanding Bitcoin’s price resistance and liquidity zones is essential. The current battle near $87,000 indicates a critical point where market sentiment could shift, affecting mining profitability. Mixed US employment data adds uncertainty, which may translate into price volatility. Recognizing support levels like the 100-week simple moving average helps miners anticipate potential price floors and plan operations accordingly.
What To Do
Miners should monitor Bitcoin’s price action around the $85,000 to $87,000 range closely, as these levels are pivotal for upcoming moves. Maintaining awareness of liquidity clusters can inform decisions about when to hold or adjust mining output. Staying updated on US economic indicators and market commentary from traders can provide context for price fluctuations. While no direct investment advice is given, understanding these dynamics aids in managing operational risks and expectations.