Bitcoin and several large altcoins are bumping into overhead resistance, with clear selling pressure when prices reach higher levels. Notably, Bitcoin is encountering significant selling near $90,500, and the price recently turned down from the 50‑day simple moving average at $90,525, which shows bears remain active at those zones.
Earlier in the week buyers pushed BTC above $90,000, but the resulting long wick on the candlestick indicates that higher prices met supply. At the same time, some altcoins display a positive divergence on the RSI, suggesting selling pressure may be easing even though bulls have not yet sustained higher levels.
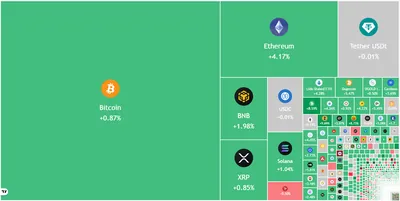
Overview of Current Market Trends
Major cryptocurrencies are testing short‑term resistance levels and often fail to hold gains at moving averages, which preserves downside risk in the near term. Several altcoins registered moves above their 20‑day EMAs or similar short‑term averages, but those gains were not consistently sustained, and sellers reasserted control at higher prices.
On the macro side, the S&P 500 recorded fresh intraday highs this week, while the US Dollar Index is trading around a contested support at 98.03. These cross‑market developments matter because they influence liquidity and trader positioning across crypto and traditional markets.
Expert Opinions on Bitcoin's Future
Bitwise chief investment officer Matt Hougan told CNBC that Bitcoin will “be up” in the next year, and he described decade‑long returns as likely strong but not spectacular. By contrast, CoinShares head of research James Butterfill highlighted $3.2 billion in outflows from crypto exchange‑traded products since Oct. 10, a sign that investor sentiment has not fully recovered yet.
Both observations point to a market where long‑term optimism can coexist with short‑term outflows and choppy price action, reinforcing the need to watch flows into digital‑asset products alongside on‑chain and technical indicators. Investors and traders should treat these expert comments as part of a broader set of signals rather than definitive forecasts.
S&P 500 Index Price Prediction
The S&P 500 made a new all‑time high midweek and followed with another intraday high, supporting the case that bulls currently control momentum in equities. If buyers keep the index above the identified short‑term pivot, the analysis in the source suggests an extension of the uptrend toward higher resistance zones, while a drop below moving averages would signal a loss of bullish control.
A decisive move below the noted support would shift the outlook toward lower targets presented in the chart analysis, whereas a strong bounce off the averages would reinforce the bullish scenario. Traders should watch those moving averages and the short‑term support levels for signs of trend continuation or reversal.
US Dollar Index Price Prediction
The US Dollar Index is described as facing a tough contest between buyers and sellers at the 98.03 support, with the bulls needing a push above the 20‑day EMA to gain control. If bulls succeed, the index may test the next moving averages and overhead resistance; if bears win, the index could slide to lower support zones.
That range‑based dynamic places the DXY in a watch‑and‑wait mode, where direction will depend on which side clears the key short‑term levels first. Movements in the dollar can affect dollar‑priced crypto flows and risk appetite, so monitoring DXY remains relevant.
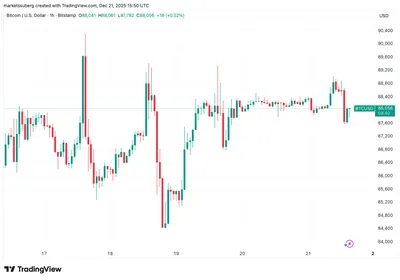
Bitcoin Price Prediction
Technically, BTC turned down from the 50‑day SMA at $90,525, and significant selling near $90,500 marks a short‑term resistance area to monitor. Buyers did push the price above $90,000 earlier in the week, but the long upper wick shows that higher levels attracted selling pressure rather than sustained buying.
If the bears keep control at higher levels, the chart analysis points to downside support zones identified in the source; conversely, a close back above the immediate resistance levels would be the first sign that bulls are regaining strength. For traders, the key is watching closes above or below these moving averages and pivot points rather than intraday noise.
Ether Price Prediction
Ether attempted to climb above its moving averages on Monday but was held down by sellers, leaving the short‑term picture uncertain. The analysis notes that a break below the symmetrical triangle support would signal a resumption of the downtrend, while a decisive break above the moving averages would point to renewed buying interest.
Traders should therefore monitor the triangle support line and the moving averages for a clear directional cue, with the next resistance area likely contested by bearish sellers. Strength above the averages would be required to consider higher targets referenced in the chart commentary.
Altcoin Price Predictions (BNB, XRP, SOL, DOGE, ADA, BCH)
BNB rose above the 20‑day EMA at $858 but encountered stiff resistance at the 50‑day SMA of $880, leaving the pair rangebound unless buyers drive a close above the 50‑day average. Solana similarly climbed above its 20‑day EMA at $126 but failed to sustain higher levels, and sellers may push SOL toward lower support zones if they strengthen their position.
Dogecoin buyers have so far defended the $0.12 support and are attempting to return above the $0.13 breakdown level, with RSI divergence suggesting some easing of selling pressure. Cardano's recovery has reached the 20‑day EMA at $0.38, a near‑term decision point, while Bitcoin Cash pierced $631 but the bulls could not close above it, keeping resistance intact. XRP faces selling at the 20‑day EMA (about $1.92), and a failure to hold gains could expose lower support levels noted in the chart analysis.
Why this matters
If you run mining equipment, these technical dynamics affect market liquidity and short‑term volatility, which in turn influence the price you can get when selling mined coins. Persistent selling near key Bitcoin resistance and outflows from investment products can keep price action choppy, so price stability is not guaranteed in the near term.
Even when you are focused on hashing power and operating costs, cross‑market moves—like the S&P 500 making new highs or the US dollar contesting support—can change trader appetite and liquidity in crypto markets. For miners in Russia with a small or mid‑sized operation, that typically means being prepared for intermittent price swings when converting mined crypto to fiat or stablecoins.
What to do?
Practical steps for miners include monitoring the technical levels highlighted above and keeping an eye on exchange inflows and outflows as liquidity signals. Control operational risk by reviewing energy costs, scheduling maintenance during low‑price periods, and keeping wallets and firmware up to date.
- Track Bitcoin resistance near $90,500 and watch for closes above/below the 50‑day SMA to gauge short‑term direction.
- Set clear conversion rules for mined coins (price thresholds, dollar‑cost averaging, or scheduled sells) that match your cash‑flow needs and electricity costs.
- Follow exchange product flows and sentiment indicators—large outflows can indicate weaker liquidity and higher price impact when selling.
- Keep equipment maintained and firmware updated to avoid downtime during favorable price moves.
For additional context on Bitcoin levels and scenarios, see the Bitcoin price forecast, and for a broader view of ETH and altcoin prospects consult the ETH and altcoins forecast. This article does not constitute investment advice; every trade carries risk and readers should make independent decisions.