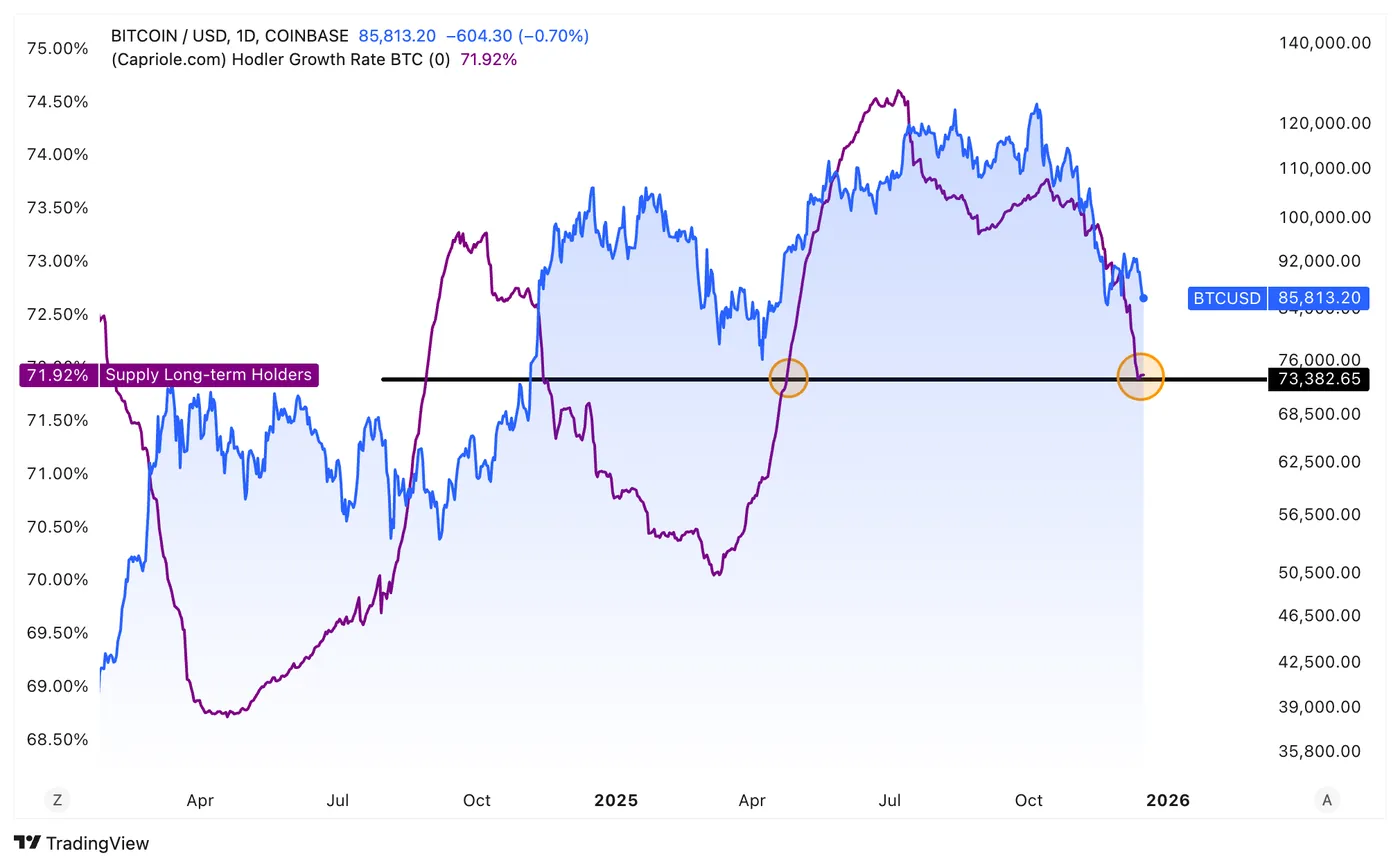
Bitcoin long-term holders (LTHs), defined as entities holding BTC for at least 155 days, have reduced their holdings from 14.8 million BTC in mid-July to 14.3 million BTC in December. This decline has lowered the share of circulating Bitcoin supply held by LTHs to 71.92%, the lowest level since April 2025. Historically, similar reductions in LTH supply have coincided with cycle peaks, such as those seen in 2017 and 2021.
Recent Trends and Onchain Data Analysis
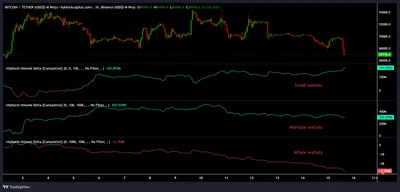
Data from CryptoQuant shows that on November 26, the LTH supply dropped by 1.1 million BTC on a rolling 30-day basis, marking the second-largest decrease on record. Over the past 30 days, LTHs have decreased their holdings by 761,000 BTC, indicating capitulation amid concerns of further price declines. Additionally, whale investors have sold $2.78 billion worth of BTC in the last month, maintaining downward pressure on the market. See also: Bitcoin Drops Below $86,000 Amid $2.78B Whale Selling Pressure
Bitcoin Price Technical Analysis and Support Levels
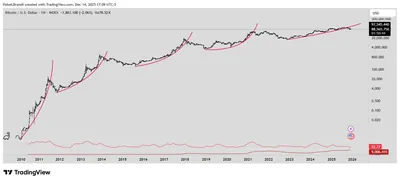
Bitcoin's technical structure weakened after losing support at the 50-week moving average and the yearly open near $93,300. The BTC/USD pair confirmed a bear flag pattern when it fell below the $92,000 boundary. Currently, key support zones lie between the local low of $83,800 reached on December 1 and the multimonth low of $80,500 from November 21. Should this support fail, a deeper correction toward the bear flag's measured target of $68,500 is possible, a level supported by the 200-week moving average. See also: Bitcoin Short-Term Holders Capitulating: What It Means for BTC Price
Expert Opinions and Market Outlook
Analyst Nic has noted that following the breakdown confirming the bearish flag, the next potential support is the 100-week exponential moving average (EMA) at $85,500. Beyond this, important onchain support levels include $83,800, corresponding to the ETF cost basis, and $81,200, representing the true market mean. Technical indicators such as the 20-day EMA turning downward and the relative strength index (RSI) entering negative territory suggest that bears currently control the market. However, if the price falls to around $84,000, LTHs might consider adding to their holdings, which could help spark a recovery. See also: Bitcoin sharks accumulate fastest since 2012 amid 30% price drop
Why This Matters
For miners operating in Russia with up to 1,000 devices, the decline in long-term holder supply signals increased selling pressure and potential volatility in Bitcoin's price. The weakening technical structure and confirmed bearish patterns suggest that prices could test lower support zones, impacting mining profitability and planning. Understanding these dynamics helps miners anticipate market movements and manage operational risks effectively.
What Should Miners Do?
- Monitor Bitcoin price levels closely, especially key support zones between $83,800 and $80,500.
- Prepare for potential price corrections toward $68,500, which could affect revenue from mining operations.
- Stay informed about long-term holder behavior and whale selling trends, as these can influence market sentiment.
- Consider operational flexibility to adjust mining activity in response to price fluctuations and market conditions.