Analysis of daily CME futures data over the past five years reveals where Bitcoin most frequently lingered and where more stable support formed. The shortest consolidation period was in the $70,000–$79,999 range — only 28 trading days — while the $80,000–$89,999 zone accounted for 49 days. Meanwhile, the lower price ranges of $30,000–$39,999 and $40,000–$49,999 experienced nearly 200 days of testing, indicating deeper verification and accumulation of positions in these areas.
Analysis of Bitcoin’s Historical Trading Data
The study relies on daily opening prices of CME futures and counts the number of trading days spent within each price corridor. This approach highlights where the market spent more time consolidating, theoretically indicating greater opportunities for position accumulation. It’s important to note that weekends are excluded from the count, so the figures reflect session openings rather than intraday fluctuations or closing prices.
Distribution of Trading Time Across Price Ranges
The count results show the $70,000–$79,999 range as the least "tested" — only 28 trading days — pointing to a weak historical concentration of positions in this zone. The higher $80,000–$89,999 range recorded 49 trading days, still fewer than the lower zones. In contrast, the $30,000–$39,999 and $40,000–$49,999 ranges together demonstrate nearly 200 days of activity, meaning the market returned there significantly more often.
Current Bitcoin Market Situation
In December 2024, most trading sessions occurred within the $80,000–$90,000 range following a sharp pullback from the October record high, as reflected in CME session data. This correction brought the price back to an area where the market historically spent less time, especially compared to 2024 periods when many days were within the $50,000–$70,000 range. For those tracking current levels and support dynamics, it’s useful to consult recent reviews and technical materials, such as today’s Bitcoin price and level analyses.
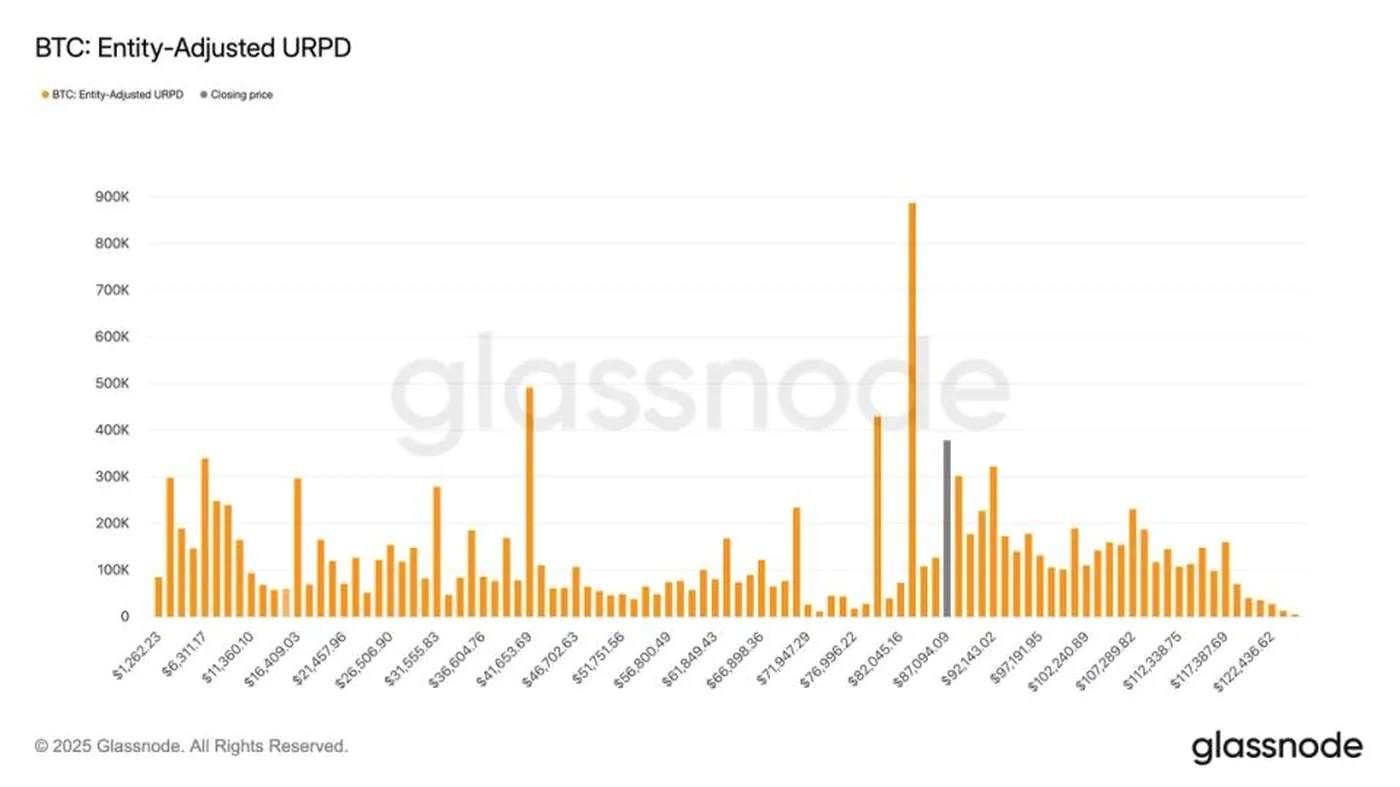
Confirmation from Glassnode Data
Glassnode data via UTXO Realized Price Distribution (URPD) shows where the current Bitcoin supply was primarily acquired at average prices, revealing a lack of supply concentration in the $70,000–$80,000 range. This UTXO distribution aligns with the futures trading day counts: both datasets indicate less developed support in this zone. Considering futures sessions and URPD together provides a more comprehensive picture than either metric alone.
Conclusions and Potential Scenarios
Overall, the data points to relatively weak historical support in the $70,000–$80,000 range compared to lower levels with more trading days. This suggests that during future corrections, the market may require more time to consolidate in this area to build sufficient supply and demand concentration. To assess risks and scenarios, it’s advisable to consider both futures history and URPD; additional context on price movement scenarios can be found in reviews of the Bitcoin price forecast and technical analysis materials.
Why This Matters
If you mine in Russia with a small or medium-sized rig setup, understanding where the market has weak historical support helps gauge the likelihood of prolonged consolidation near current levels. In zones with weak support, clients and miners may face greater volatility when prices return to these ranges, affecting profitability calculations and equipment payback periods. Even if there’s no direct impact on your operations now, knowing these levels aids in planning purchases, sales, and capacity management considering potential instability periods.
What to Do?
- Recalculate profitability at current and lower prices: check margins and payback times for your number of devices.
- Optimize electricity consumption: redistribute loads and work schedules where possible to withstand volatility periods.
- Monitor liquidity and demand levels: track volume data and supply distribution, including URPD, to understand where the market might "pause" longer.
- Have a plan for corrections: predefine technical and financial triggers for temporarily scaling mining operations up or down.
- Read analytical materials and compare scenarios: regularly updating information helps make more informed decisions, for example regarding long-term equipment operation.