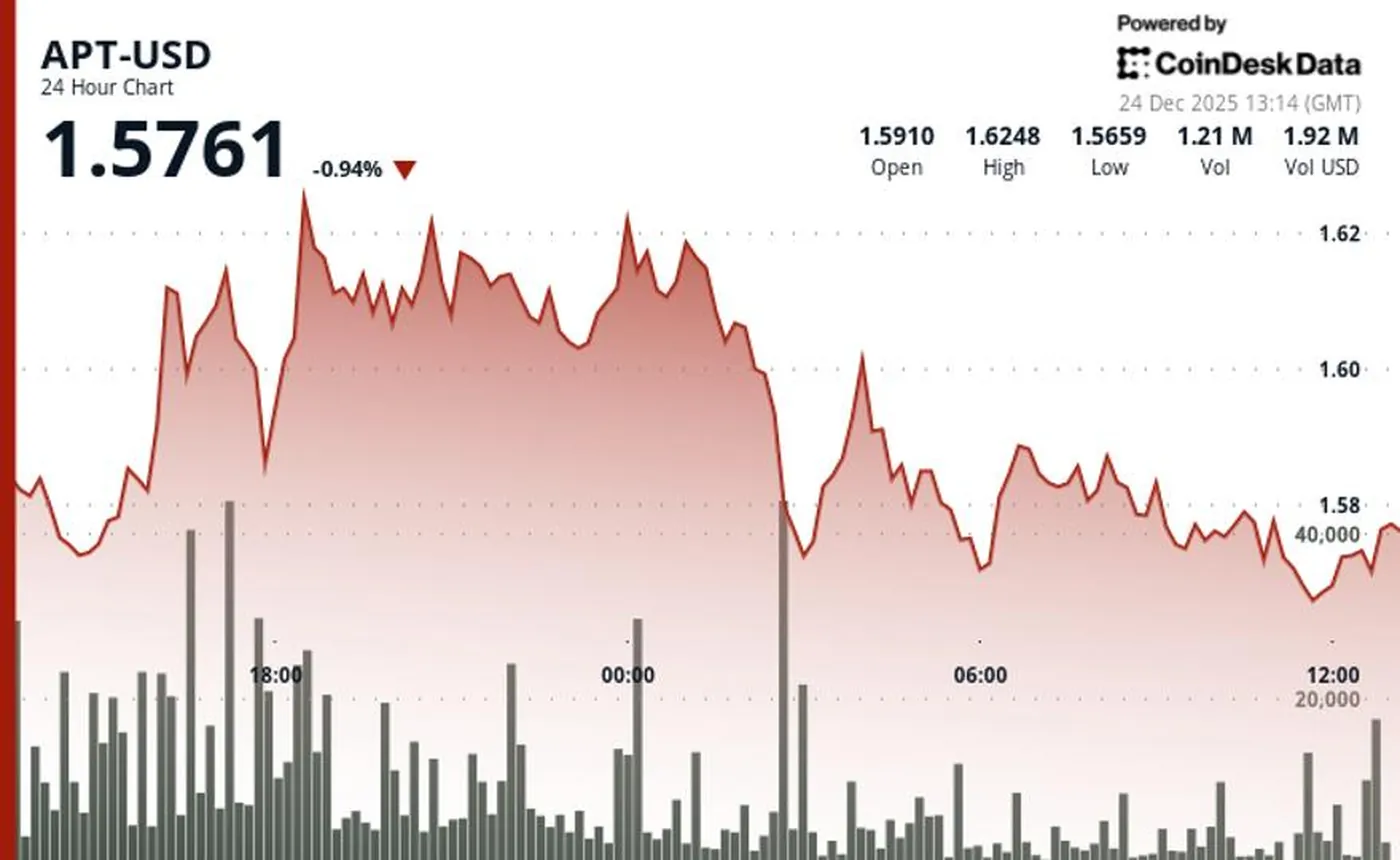
APT dropped 1% and is trading around $1.56 over the past 24 hours, mirroring the overall weakness in the crypto market. At the time of publication, the CoinDesk 20 index was also down 0.6%, indicating synchronized movement across many assets.
Overview of Aptos (APT) Price Decline
During the reported 24-hour period, the token traded within a range of $1.62–$1.56, reflecting a $0.06 difference and intraday volatility of 3.6%. Technical analysis models highlight a tug-of-war between bulls and bears near the $1.63 resistance level, while support held close to $1.56.
Volatility and Trading Volume Analysis
Trading volume saw a notable increase: it exceeded the 24-hour average by 71%, reaching 4.69 million tokens, coinciding with selling pressure from the session peak at $1.62. However, over a broader timeframe, volume is down 11% compared to 30-day metrics, which analysts attribute to trader fatigue and more subdued activity.
Technical Analysis and Support/Resistance Levels
The model recorded the completion of a double bottom formation at $1.52 support, followed by a bounce above the $1.56 resistance. Major resistance remains at $1.66, which has held through multiple tests. Meanwhile, consolidation of support around $1.56 underscores the importance of this level for near-term price movements.
Forecasts and Potential Price Movements
Technical levels suggest two clear trajectories: a breakout upward targets the resistance cluster at $1.58–$1.585, while a breakdown opens the path for a retest of $1.52 support. These scenarios reflect the balance of power between buyers and sellers around key price points.
Why This Matters
For miners, even small price movements and volume spikes impact market liquidity and immediate selling opportunities. Understanding where the nearest support and resistance levels lie helps decide whether to take profits or hold positions amid short-term fluctuations.
Additionally, the volume decline compared to 30-day trends signals overall market participant fatigue, making sharp impulses less predictable and increasing the likelihood of spontaneous liquidity surges. If you follow the broader market, it’s useful to compare APT’s behavior with major assets and indexes, such as in the market analysis and forecasts or the miner essentials overview to understand overall dynamics.
What to Do?
If you operate from one to several hundred devices, follow simple risk management rules: assess how current support levels at $1.56 and $1.52 align with your profit targets and risk tolerance, and predefine exit points. During high volatility, avoid emergency sales at volume peaks—they may coincide with temporary selling pressure.
Practical steps for miners include regularly checking liquidity and volumes before major transactions, keeping some funds in reserve to cover operational costs during short-term drawdowns, and using stop orders or staged profit-taking if you need to reduce risk without urgent full liquidation.
Additional Resources
To compare APT’s current dynamics with other tokens and understand reasons behind mass sell-offs, see the review why Bitcoin and Ethereum are falling and related token materials. These articles help determine whether APT’s moves are local or part of a broader market correction.