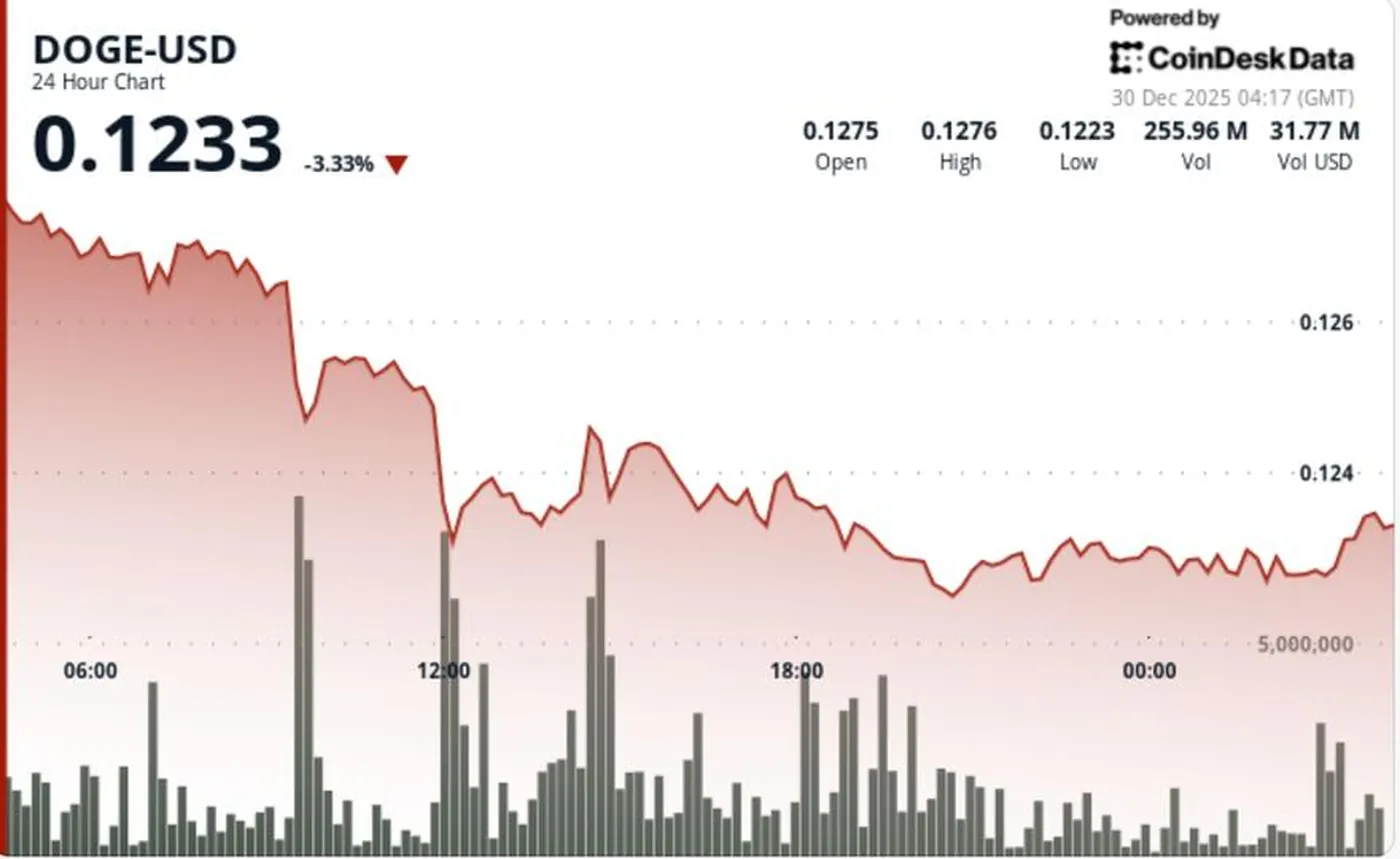
Dogecoin lost 3%, falling to $0.1226 after year-end selling pressure pushed the coin through a key support zone. At the peak trading moment, the price broke below $0.1248, with trading volume approximately 157% above average, indicating genuine supply distribution rather than a slow decline due to low liquidity. During the decisive downward wave, about 857 million DOGE changed hands, confirming the scale of the sell-off.
Reasons Behind Dogecoin's Decline
The main driver of the drop was intensified year-end positioning: investors reduced risk amid declining liquidity and holiday trading. The break below $0.1248 acted as a technical trigger for further position unwinding, with volume confirming active supply presence. Simultaneously, large holders continued distributing tokens, limiting the potential for sustained rebounds.
Market Background Factors
Whale wallets distributed roughly 150 million DOGE over the past five days, suppressing rebound rallies even as trading hovered near the lower range boundary. On the derivatives market, open interest climbed back above $1.5 billion, showing that a significant portion of participants maintain exposure in futures. Together, this creates a divergence between weaker spot demand and active futures betting, sustaining volatility.
Technical Analysis
The key technical level is $0.1248: its breach pushed the price into the $0.122–$0.123 zone, where the nearest demand currently concentrates. Trading volume and the transfer of approximately 857 million DOGE during the decline point to distribution rather than a calm price dip. The current structure shows a descending channel with successive lower highs; an RSI near 37 signals oversold conditions but was insufficient to reverse the trend.
What Traders Need to Know
Key levels to watch are $0.1226—the current decision point, $0.1248—the previous support zone, and $0.1270—the nearest resistance on a bounce. If $0.1226 holds and the price quickly breaks back above $0.1248, a range-bound rebound toward $0.1270 is possible; a break below could lead to a pullback to lower levels where prior demand zones and the channel boundary converge. The market tone remains defensive, and low liquidity means moves may occur faster than usual.
Why This Matters
For miners operating 1–1000 devices, market conditions mainly affect the value of held DOGE and trader behavior when selling coins. Pressure from large holders and high volumes mean spot rallies are more easily absorbed by supply, reducing chances for quick profitable sales. Additionally, increased volatility amid thin liquidity makes sharp price moves more likely, an important factor when planning sales to cover operational costs.
What To Do?
Miners in Russia should have a clear action plan: first, monitor the $0.1248 and $0.1226 levels and respond according to your liquidity strategy—selling in small portions or holding if focused on a long-term position. Second, note that open interest above $1.5 billion indicates active futures markets—watch market structure and avoid large market sales during low liquidity periods. Finally, use stop orders and stagger sales to reduce the risk of unfavorable slippage; for more detailed guidance on price movement impacts on mining and equipment, see the technical analysis and mining impact.
If you want to review recent levels and dynamics after the break, the article on the previous support break provides additional insight into recent moves on the support break. This helps understand how quickly the market previously reacted to similar events and which rebound scenarios failed due to overhead supply.